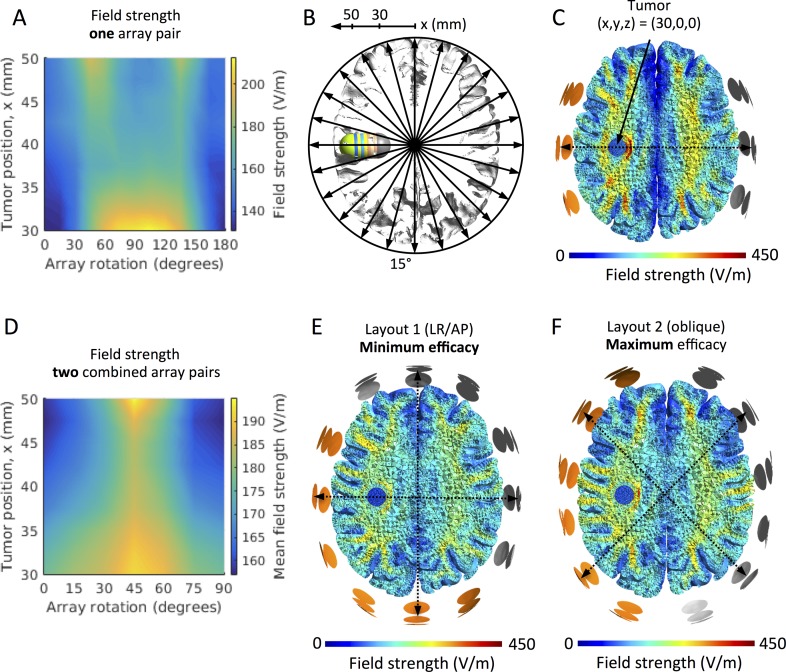
Fig 2. Effect of array rotation on field intensity for left-right tumor translations on the x-axis.
A. Color map of the median field intensity (V/m) in the tumors at varying x-positions (30 mm to 50 mm, ordinate) and varying rotations (θ = 0 to 180 degrees, abscissa) of a single pair of electrode arrays. Y- and z-coordinates were kept constantly at zero for all tumors, i.e. all tumors were in the center-to-center plane of the rotated array pairs. The figure shows field maxima at θ = 45 and 135 degrees, respectively, for all tumors between x = 35 mm and 50 mm, while deeper seated tumors experienced high fields for all rotations between these values. B. Axial section of the GM and WM surfaces and the investigated tumors (x translations, i.e. x = 30 to 50 mm, y = 0 mm, and z = 0 mm). Array rotations and tumor locations are indicated by the corresponding arrows and axis, respectively. C. Axial section (radiological convention) of the WM, GM and tumor volume (x = 30 mm, position indicated by the solid arrow), showing an example of the topographical distribution of the field induced by TTFields (left-right array position, θ = 90 degrees). D. Color map comparable to panel A, but illustrating the mean field induced by two orthogonal array pairs. Tumor positions are indicated on the ordinate and the rotations of the posterior array on the abscissa (θ = 0 to 90 degrees). The figure shows a maximum mean field intensity at θ = 45 degrees equivalent to an oblique position of both pairs. The field distribution of this “optimal” layout is shown in panel F for the tumor position x = 30 mm, while the distribution of the least effective layout (θ = 0 degrees) for the same tumor is shown in panel E.

