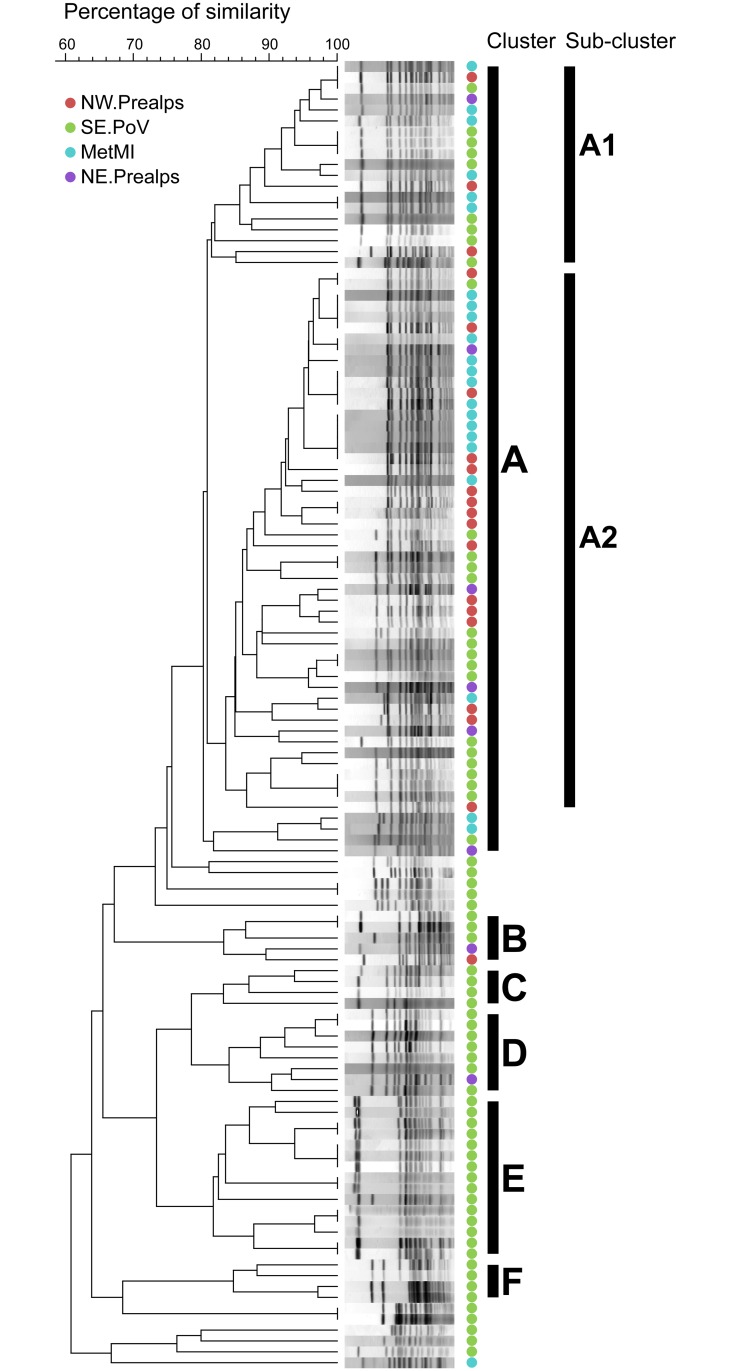
Fig 2. PFGE clustering.
PFGE Dendrogram of 120 clinical isolates from Northern Italy. PFGE clusters were identified with letters from A to F. Genetic analysis was based on 80% similarity. Cluster A is subdivided into two main sub-clusters, A1 and A2. The geographic areas of isolation are color-coded: North Western Prealps (NW.Prealps, red), South-Eastern Po Valley (SE.PoV, green), Metropolitan area of Milan (MetMI, cyan), and North-Eastern Prealps (NE.Prealps, purple).

