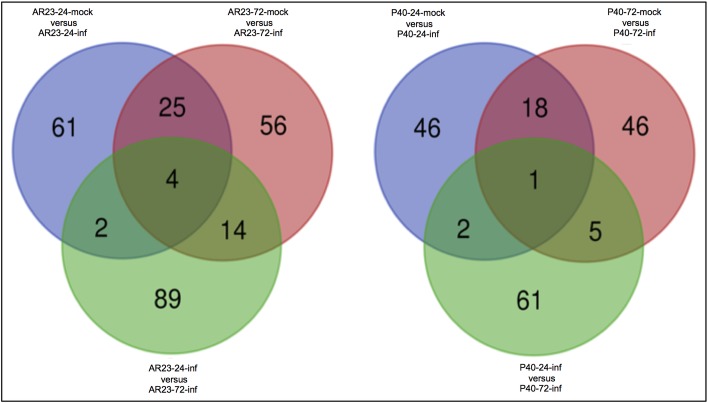
Fig 4. Venn diagrams of differentially expressed genes (DEGs).
A comparison of DEGs that were common across different time points (24 and 72 hours compared to non-infested mock) in AR23.1 and P40/1 post-infestation with P. manihoti. The Venn diagrams represent an average across all three biological replicates at respective time points. Only transcripts with a minimum of log2 fold change and P ≤ 0.05 were included in the data.

