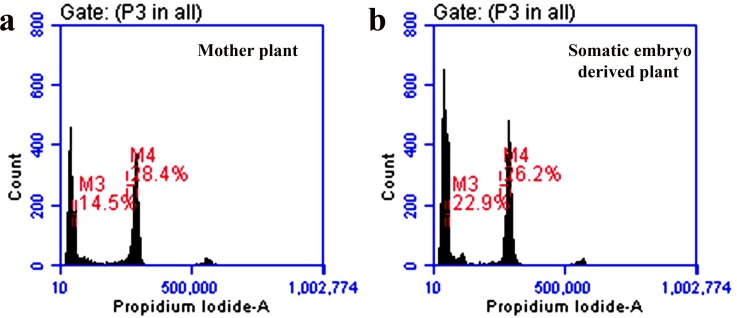
Fig 4. Flow cytometry profiles of the mother and somatic embryo derived plants of H. sabdariffa var. HS 4288.
Histogram fluorescence intensity documenting the relative DNA content of the nuclear suspension from young roots of (a) mother (M4) and (b) somatic embryo derived plants (M4); in both figure a. and figure b., the peaks indicated as (M3) correspond to the internal reference standard of Oryza sativa (IR36).

