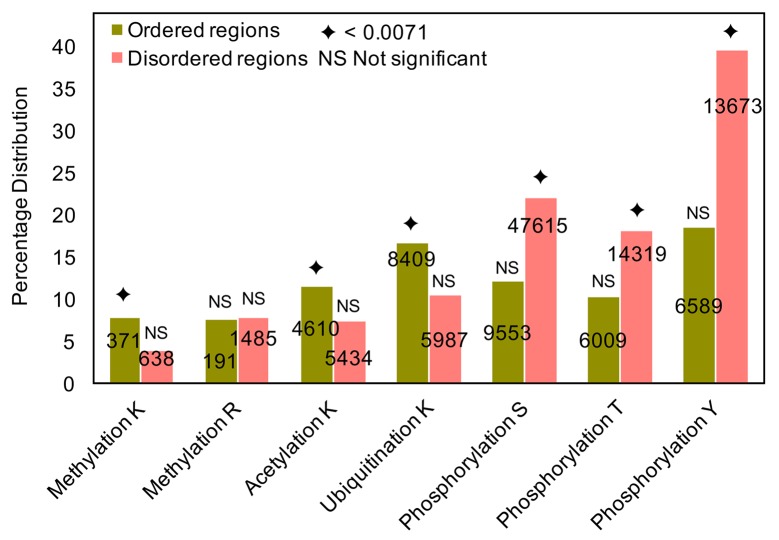
Fig 2. Percentage distribution of MAU and phosphorylation sites in ordered and disordered regions of human proteins.
Percentages of MAU and phosphorylation sites (out of the total number of residues of the same type) in ordered and disordered regions of the human proteins analysed. The total number of each site present in ordered (olive green) and disordered (peach) regions are given in the centre of the bar. The hypergeometric distribution is used to identify the enrichment of MAU-modified residues in (dis)ordered regions in all lysines/arginines present in both ordered and disordered regions, with the total set of MAU sites as background population, and the diamond symbol on top of the bar indicates the corrected P-value (0.0071) for significant enrichment of PTMs in ordered and disordered regions, and NS represents non-significant enrichment.

