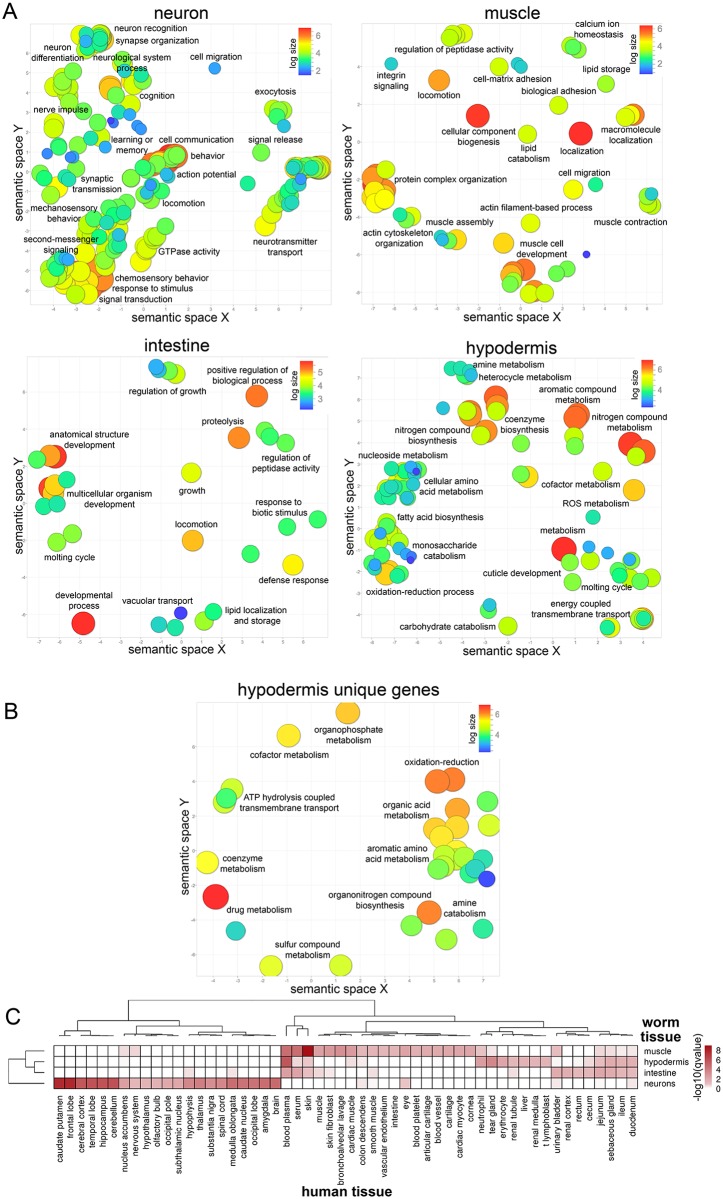
Fig 2. Characterization of tissue-enriched gene sets.
A) Gene ontology analysis of each tissue-enriched gene list (S2 Table). GO terms with padj < 0.05 (hypergeometric test) were plotted using REVIGO. Log size and was determined by the frequency of the GO term in the GO term database, where larger bubbles represent more general GO terms. Each label refers to an individual circle that is representative of the cluster of GO terms in its vicinity. B) Gene ontology analysis of the hypodermis unique gene list (S9 Table). Log size and was determined by the frequency of the GO term in the GO term database, where larger bubbles represent more general GO terms. Each label refers to an individual circle that is representative of the cluster of GO terms in its vicinity. C) Comparison of each worm tissue (human orthologs of muscle, hypodermis, intestine, and neuron tissue-enriched gene lists) to human tissues (HPRD gene annotations [31]). Human tissues with q-value < 0.05 (hypergeometric test) were plotted (values plotted are −log10(q-value), white = not significant, dark red = highly significant enrichment).

