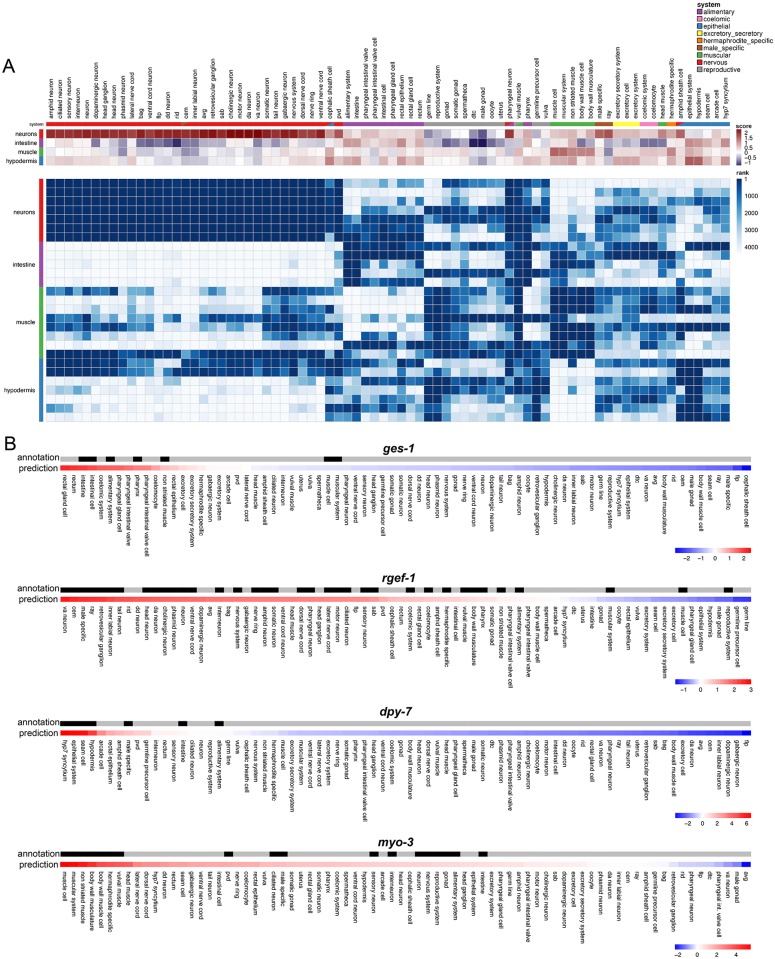
Fig 6. Tissue specificity of Insulin signaling/DAF-16 target expression.
A) Top: Concordance between predicted tissue expression scores and tissue-ome (isolated tissue RNA-seq) samples. Each row represents one of 4 tissue-ome tissues for which tissue-enriched genes were identified, and each column represents one of 76 tissues for which predictions were made. Columns were hierarchically clustered, and the tissue system(s) for each tissue is indicated. Each cell represents average predicted tissue expression (normalized SVM) score for corresponding tissue-enriched genes Bottom: Contribution of tissue-ome samples to tissue-gene prediction models. Each row represents one of 27 tissue-ome samples (across 4 tissues), and each column represents one of 76 tissues for which predictions were made. Row and column orderings are as in A. Each cell represents rank of sample in contribution to the corresponding tissue model. B) Wormbase curated gene annotations are shown in black for ges-1, rgef-1, dpy-7, and myo-3. Below the annotations are the predictions for each gene, where red corresponds to the highest prediction score and blue is the lowest prediction score.

