Abstract
Objective
To determine whether lower socioeconomic status (SES) is associated with worse 1-year neurologic outcomes and reduced access to rehabilitation services in children with arterial ischemic stroke (AIS).
Methods
From 2010 to 2014, the Vascular effects of Infection in Pediatric Stroke (VIPS) observational study prospectively enrolled and confirmed 355 children (age 29 days–18 years) with AIS at 37 international centers. SES markers measured via parental interview included annual household income (US dollars) at the time of enrollment, maternal education level, and rural/suburban/urban residence. Receipt of rehabilitation services was measured by parental report. Pediatric Stroke Outcome Measure scores were categorized as 0 to 1, 1.5 to 3, 3.5 to 6, and 6.5 to 10. Univariate and multivariable ordinal logistic regression models examined potential predictors of outcome.
Results
At 12 ± 3 months after stroke, 320 children had documented outcome measurements, including 15 who had died. In univariate analysis, very low income (<US $10,000), but not other markers of SES, was associated with worse outcomes (odds ratio [OR] 3.13, 95% confidence interval [CI] 1.43–6.88, p = 0.004). In multivariable analysis, including adjustment for stroke etiology, this association persisted (OR 3.17, 95% CI 1.18–8.47, p = 0.02). Income did not correlate with receiving rehabilitation services at 1 year after stroke; however, quality and quantity of services were not assessed.
Conclusions
In a large, multinational, prospective cohort of children with AIS, low income was associated with worse neurologic outcomes compared to higher income levels. This difference was not explained by stroke type, neurologic comorbidities, or reported use of rehabilitation services. The root causes of this disparity are not clear and warrant further investigation.
While adult stroke studies have described the influence of socioeconomic status (SES) on stroke incidence, severity, and outcome,1–6 childhood stroke studies have rarely measured SES. The Vascular Effects of Infection in Pediatric Stroke (VIPS) study, a large, prospective, observational international study of children with arterial ischemic stroke (AIS), measured SES in cases and stroke-free controls through parental report and found a robust association between lower SES and incident AIS.7 The association was observed regardless of the SES measure used (rural residence, household income, or maternal education) and persisted after adjustment for multiple other risk factors, including exposure to infection and trauma.
Up to 60% of children with AIS have ongoing, significant functional impairments, although the timing of outcome assessments and the measures used have varied in pediatric stroke outcome studies.8 Poorer outcome in children has been associated with greater infarct volume,9 seizures at stroke onset,10 and stroke recurrence.11 Lower SES, a predictor of poorer outcomes after adult stroke, could influence poststroke outcomes in children but has not been studied.
The primary aim of this study was to determine in the VIPS cohort whether the relationship of low SES and initial risk of incident AIS extends to an association with worse neurologic outcomes at 1 year after stroke in children. Our a priori hypothesis was that low SES would worsen outcome after stroke in children. We also sought to assess the effect of SES on receipt of rehabilitation services in this large, international pediatric stroke cohort.
Methods
Study design and population
From January 2010 to March 2014, the VIPS study enrolled 355 children (age 29 days–18 years at stroke onset) with AIS at 37 centers in 9 countries, including 3 in lower- and middle-income (LAMI) countries as defined by the World Bank in 201012: the Philippines, Serbia, and China. The study setting and methods for identifying, confirming, and characterizing cases in VIPS have been published.7,13,14 A central team of 2 neuroradiologists and 1 neurologist reviewed the clinical presentation and brain imaging of every enrolled case to confirm the index AIS diagnosis, defined a priori as an acute infarction in an arterial territory with corresponding clinical signs and symptoms. Local site investigators or study coordinators collected information on demographics, stroke presentation, and etiologic evaluations. A standardized parental interview,7,13 administered within 1 week of enrollment, included measures of SES and race/ethnicity. As outlined in the methods article, the sample size for the VIPS study was based on power calculations for the primary association of interest in the parent study, between recent infection (within 4 weeks of the stroke onset) and focal cerebral arteriopathy of childhood.13
Outcome assessment
Our primary outcome for this analysis was a neurologic assessment at 1 year after stroke onset. If the participant returned to clinic at the enrolling center, a neurologist performed a formal examination to complete the Pediatric Stroke Outcome Measure (PSOM), a validated, reliable, standardized measure of neurologic deficit and function.15 The PSOM consists of standard neurologic examination items (mental status, cranial nerves, motor, sensory, cerebellar, and gait). The total PSOM is summed from 5 individual subscales—sensorimotor (right and left), language comprehension, language production, and cognitive/behavioral deficit—and ranges from 0 (no deficits) to a maximum score of 10.15 If a child was unable to return to the clinic, the site investigator or study coordinator administered the Pediatric Stroke Recovery and Recurrence Questionnaire (RRQ), a scripted parental interview, via telephone.16 The RRQ has been validated against the neurologist-administered PSOM,16 follows the format of the clinical examination, and is similarly scored.
Most children received multiple assessments after discharge from the hospital. In determining which best represented the 12-month outcome, we preferentially used, when available, a formal PSOM administered in the clinic by a neurologist at 12 ± 3 months after stroke. If unavailable, we used the RRQ derived from parental interview obtained during the same time period. If neither a PSOM nor RRQ was administered within this time frame, we used the examination that was closest to it in time; in this case, timing took preference over type of examination. Because children deemed to be fully recovered at their 1-year examination were not required to have a PSOM, children who were so documented were assigned a PSOM score of 0. Deceased children were assigned a PSOM score of 10 and were included in all analyses. Although a number of prior studies have dichotomized outcome, defining any PSOM score ≥1 as poor,10,17 we were able, with our larger cohort, to use a more granular representation of outcome. On the basis of prior literature, we broke down PSOM scores into 4 categories (0–1, 1.5–3, 3.5–6, and 6.5–10)18 to examine outcome in finer detail.
Markers of SES
We used 3 markers for low SES on the basis of a review of prior literature and assessed by parental interview at study enrollment: a reported annual household income below US $10,000, a mother with less than a high school education, and residence in a rural area.19,20 Income was converted to US dollars by the local investigator and categorized as <$10,000, $10,000 to $30,000, $30,000 to $50,000, $50,000 to $100,000, and >$100,000. Highest income was used as a reference.
Other predictors
Predictor variables were defined as described in prior VIPS publications.13,21 Age was categorized as <4, 4 to 7, 8 to 11, 12 to 15, and 16 to 18 years. Stroke etiology was categorized as idiopathic, cardioembolic, arteriopathic, and other on the basis of central adjudication as previously described.21
To adjust for prior neurologic disorders that would likely be associated with worse outcome, we created a composite variable that included prior AIS, developmental delay, language disability, cerebral palsy, and status epilepticus, among others. Receipt of rehabilitation services (measured by parental report on the RRQ) included receiving any occupational, physical, or speech therapy at the time of 1-year outcome assessment.
Standard protocol approvals, registrations, and patient consents
Approval from an ethics standards committee on human experimentation was obtained at each enrolling site. Written informed consent was obtained from all guardians of children participating in the study.
Data analysis
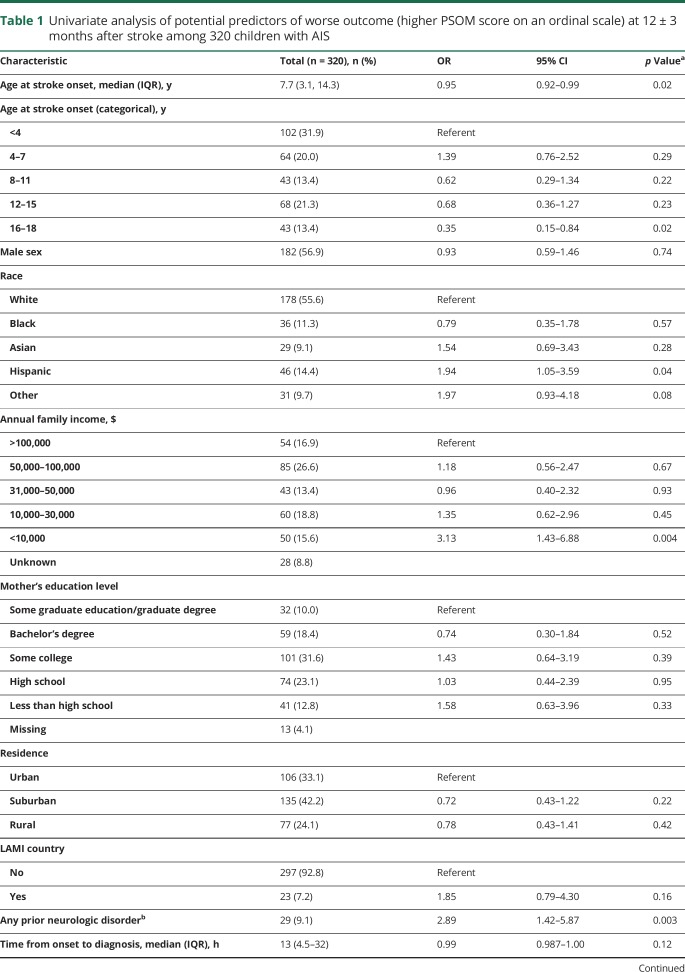
Characteristics of the cohort were described using the median and interquartile range (IQR) for continuous variables and frequencies and proportions for binary and categorical variables. Income and maternal education level were treated as ordinal variables (5 levels each), and residence was treated as a nominal variable with 3 categories (rural, suburban, urban); all are presented in table 1. Summary statistics were calculated for the total cohort and stratified by categorical PSOM score. Potential associations between SES indicators and receipt of rehabilitation services at 1 year were examined with χ2 tests.
Table 1.
Univariate analysis of potential predictors of worse outcome (higher PSOM score on an ordinal scale) at 12 ± 3 months after stroke among 320 children with AIS
We examined SES determinants and other potential predictors of the categorized PSOM score at 1 year after stroke using univariate ordinal logistic regression models. These models are designed for ordinal categorical outcomes, with the underlying assumption that the relationship between each outcome category is the same; e.g., the coefficients that describe the relationship between the lowest PSOM category (PSOM score 0–0.5) compared to all higher categories are the same as those describing the relationship between the next lowest PSOM category and all categories that are higher than this category. This proportional odds assumption postulates an identical relationship between all pairs of groups and therefore generates only 1 set of coefficients. To evaluate the validity of the proportional odds assumption, we conducted a Brant test after each regression model.
We then constructed multivariable ordinal logistic regression models that included our markers of SES, adjusted for those predictors found significant at the α = 0.05 level in univariate analysis. We examined differences between LAMI and high-income countries in terms of outcomes and factors that might affect outcomes (such as use of rehabilitation services) using stratified techniques. It was difficult to separate out the effect of low income from other effects of living in an LAMI country (such as access to resources). We therefore conducted sensitivity analyses in which LAMI countries were excluded from our models and only the highest-income countries contributing a sufficient number of children were included (United States, United Kingdom, Australia, Canada). These results were compared to results that included all sites from all countries, regardless of economic status. All analyses were conducted with Stata version 14 (StataCorp, College Station, TX) with α set at 0.05.
Data availability
Data available from Dryad (tables 1–3, doi:10.5061/dryad.vp34f2q). Anonymized data will be shared by request from any qualified investigator.
Results
Study population
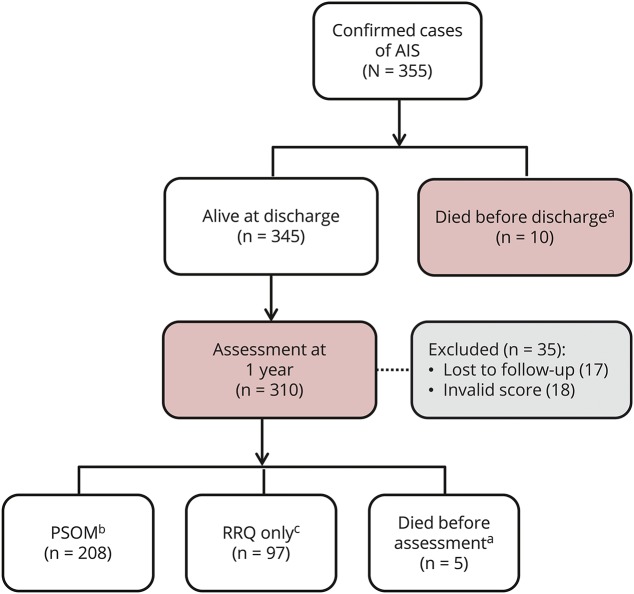
Of the 355 children with AIS included in the VIPS cohort, neurologic outcomes 1 year after stroke were available for 320 (90%) (figure 1): 10 died before discharge, 5 died within the first year, and 305 had a qualifying outcome assessment (n = 208 formal PSOMs; n = 97 parental PSOMs from the RRQ). There were no differences between the 320 children with documented outcome data and those lost to follow-up (data available from Dryad, table 1, doi.org/10.5061/dryad.vp34f2q). The median age was 7.7 years (IQR 3.1–14.3 years); 56.9% were male. The greatest number of strokes occurred in children <4 years of age (31.9%). Children from LAMI countries made up 7.2% of the outcomes cohort.
Figure 1. VIPS patients (n = 320) included in outcomes analyses (red-shaded boxes): 10 patients who died before discharge and 310 patients with outcomes assessments at 1 year.
aAssigned Pediatric Stroke Outcome Measure (PSOM) score of 10. bFormal PSOM score directly assessed by site neurologist performing a neurologic examination. cParental PSOM score indirectly assessed by parental interview with the Pediatric Stroke Recovery and Recurrence Questionnaire. AIS = arterial ischemic stroke; VIPS = Vascular Effects of Infection in Pediatric Stroke.
1-Year outcomes
Follow-up was assessed at a median of 12 months (IQR 11–13 months) after AIS; 34.7% of cases had no deficits (PSOM score 0), and 30.0% had mild deficits (PSOM score 0.5–1). Moderate to severe impairment in function was present in the minority: 18.8% with a PSOM score of 1.5 to 3, 8.4% with a PSOM score of 3.5 to 6, and 3.4% with a PSOM score of 6.5 to 10 (data available from Dryad, table 2, doi.org/10.5061/dryad.vp34f2q). Mortality was 2.8% (10 of 355) at hospital discharge and 4.2% (15 of 355) by 12 months after stroke. This represented 4.7% (15 of 320) of the children with 1-year follow-up.
Univariate and multivariable predictors of outcome
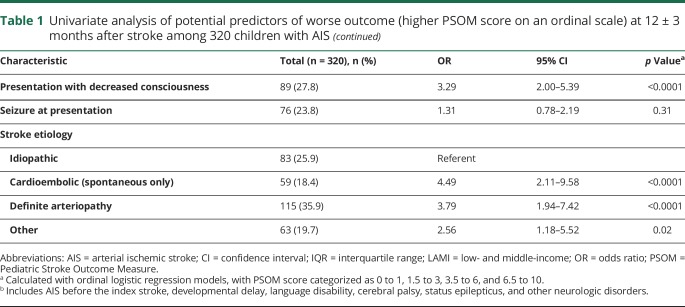
In unadjusted analyses (table 1), the only measure of SES linked to worse outcome was annual family income. Very low income (<US $10,000) more than tripled the risk of worse outcome (odds ratio [OR] 3.13, 95% confidence interval [CI] 1.43–6.88) compared to high income (>US $100,000) (figure 2). Using a nonparametric test of trend (an extension of the Wilcoxon rank-sum test), we found significantly worse outcome across the 3 lowest income groups (p < 0.001). Both cardioembolic and arteriopathic strokes were strongly associated with poorer outcome compared to the reference group, idiopathic stroke. Children in the lowest income group were more likely to present with decreased level of consciousness: 54% of children in the <$10,000 annual income group; 20% in the $10,000 to $30,000 group; 25.6% in the $31,000 to $50,000 group; 24.7% in the $51,000 to $100,000 group; and 22.2% in the >$100,000 group (p < 0.001, χ2). Presenting with decreased level of consciousness and documentation of a prior neurologic disorder were also associated with worse outcomes at 1 year.
Figure 2. Percentage of children in each outcome category according to income level.
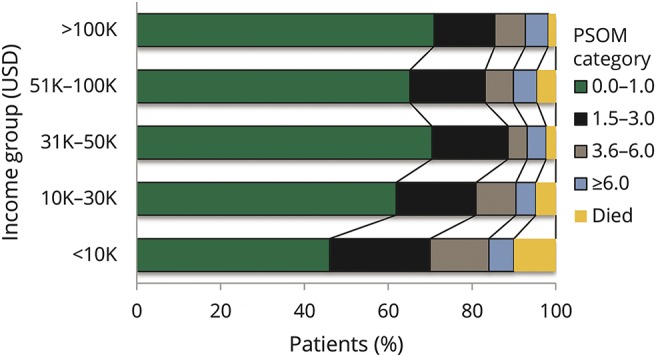
PSOM = Pediatric Stroke Outcome Measure; USD = US dollars.
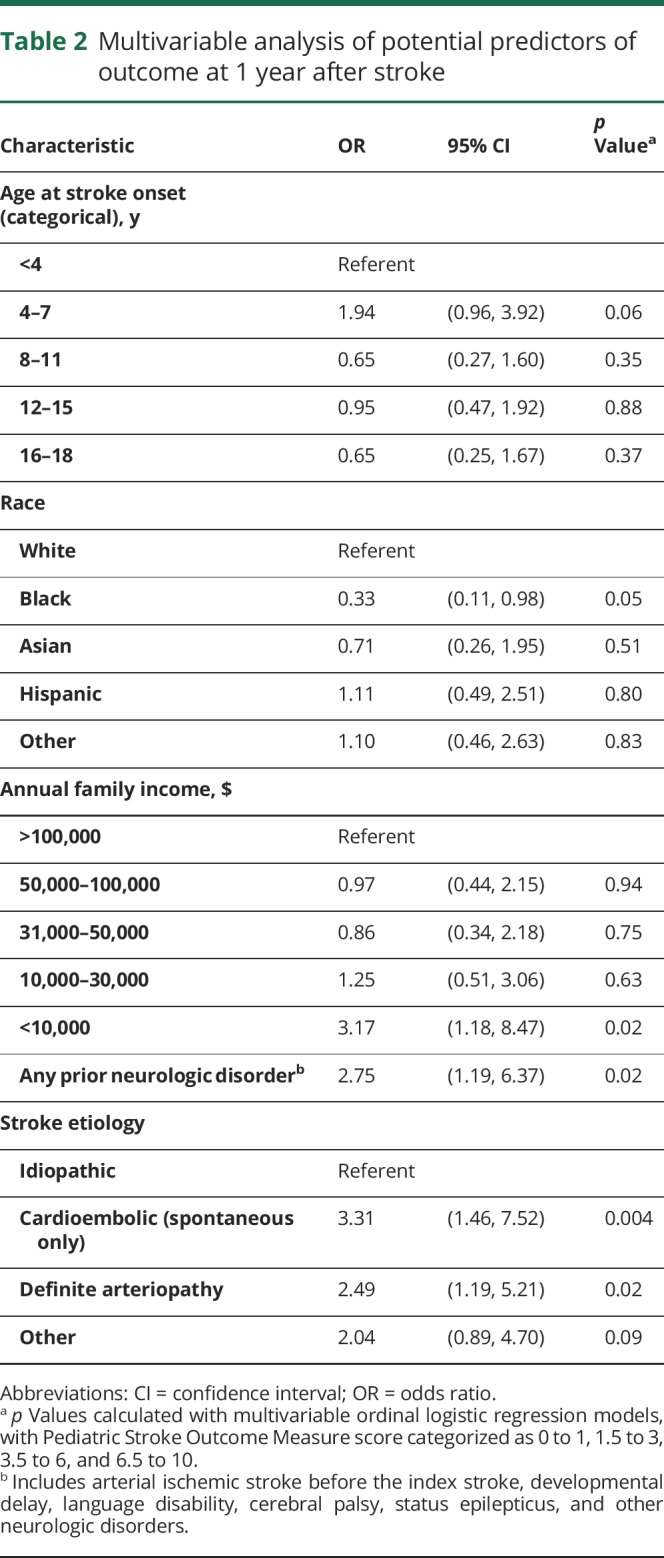
In choosing a multivariable model, we first included all variables significant in univariate analysis. Because presenting with decreased consciousness was highly correlated with low income (with 54% of the children in the lowest income group presenting with decreased consciousness compared to 20%–26% in the other income groups), the 2 variables were not independently predictive of outcome in multivariable analysis. We therefore did not include decreased consciousness in our final model, in which very low income remained significantly associated with poorer outcome, even when adjusted for prior neurologic disorder, stroke etiology, age, sex, and race (table 2). We also reran the model using lowest category of income as a reference. We observed significantly worse outcomes when the lowest income category was compared to each of the higher income categories: <$10,000 vs $10,000 to $30,000 (OR 2.54, 95% CI 1.11–5.83, p = 0.028); <$10,000 vs $31,000 to $50,000 (OR 3.68, 95% CI 1.38–9.83, p = 0.009); <$10,000 vs $51,000 to $100,000 (OR 3.26, 95% CI 1.36–7.8, p = 0.0084); and <$10,000 vs $100,000+ (OR 3.17, 95% CI 1.18–8.47, p = 0.02).
Table 2.
Multivariable analysis of potential predictors of outcome at 1 year after stroke
LAMI and high-income countries
Of 23 childhood AIS cases in LAMI countries, 87% had an annual income <US $10,000 compared to 11% of 269 cases in high-income countries (28 children from 297 high-income countries did not have individual income data). Overall, there was a similar frequency of good outcomes (PSOM score 0–1) for children from LAMI (13 of 23, 57%) vs high-income (194 of 297, 65%, p = 0.40) countries. The frequency of outcomes with very high PSOM score >3 was greater in LAMI countries (35%) than high-income countries (15%), although the association between worse neurologic outcomes and LAMI countries was not statistically significant (OR 1.85, 95% CI 0.79–4.30, p = 0.16). To further explore the association between income and outcome, we analyzed participants from only the 4 highest-income countries with individual income data: Australia, Canada, the United States, and the United Kingdom (n = 253) (data available from Dryad, table 3, doi.org/10.5061/dryad.vp34f2q). The association between very low income (<US $10,000) and worse outcome was no longer significant.
SES and receipt of rehabilitation
At 1 year after stroke, 64 children (20%) were receiving speech therapy, 92 children (29%) were receiving occupational therapy, and 101 (32%) were receiving physical therapy. Those receiving therapy had a higher PSOM score (median 2, IQR 1–3.5) compared with those not receiving therapy (median PSOM score 0.5, IQR 0–1, p < 0.001). Children with poorer neurologic function were still receiving therapy at 1 year. There was no difference in the proportion of children reported to be receiving rehabilitation at 12 months after stroke when stratified by income (p = 0.47), maternal education (p = 0.40), or residence location (p = 0.93). At 12 months, 37% of children in the highest income category and 38% of children in the lowest income category were receiving physical, occupational, or speech rehabilitation services (p = 0.47). When children from LAMI countries were removed, 47% of children with annual income <US $10,000 received rehabilitation services at 12 months after stroke compared with 37% in the highest-income group (p = 0.45).
Discussion
In the VIPS cohort, very low income (annual income <US $10,000) is associated with worse 1-year neurologic outcomes after AIS in children. Our other markers of SES, maternal education and rural residence, were not associated with outcome. Across income strata, equivalent proportions of children were reported as receiving rehabilitation services at 1 year, although we were unable to assess the quantity or quality of rehabilitation services received. Poorer quality or reduced frequency of rehabilitation could contribute to the socioeconomic disparity in outcome observed. In the VIPS study, multiple markers of lower SES (rural residence, lower household income, and lower maternal education) were robustly associated with a higher incidence of childhood AIS.7 A greater percentage of children with AIS (15.5%) came from households with very low income compared with controls (8.5%, p = 0.001).
The reasons for the associations between low SES, incident stroke, and worse outcome in children are unclear. Stroke in children is less influenced by chronic adult diseases such as hypertension, diabetes mellitus, and atherosclerosis and by smoking, so the effects of low SES on differential access to health care may have less bearing on stroke incidence and outcome in children than adults. In higher-income countries, there are programs providing access to medical care for children.22 However, barriers to care exist related to low SES such as difficulties in procuring transportation and parental time off of work to attend appointments.
Although decreased level of consciousness at presentation was significantly associated with an increased risk of poor outcome, it was highly correlated with the lowest income category and was therefore excluded from the final model. The reason for this correlation is unclear. The time from onset to arrival in the emergency department and from onset to diagnosis did not differ by income, although low-income children tended to be younger (median age 3.7 vs 7.6 years in the cohort overall), in which case subtle stroke symptoms would be more difficult to detect. We might also hypothesize that in lower-income settings, more severe/noticeable stroke symptoms might be necessary to justify seeking medical help. In addition, the level of consciousness was reported as unknown in a number of children, thus adding to the uncertainty of this symptom as a predictor of outcomes at 1 year. There are unmeasured variables, e.g., nutritional status, that could play a role in why lowest-income children have worse outcomes than children in any other income group. Ultimately, our data provide evidence that SES may affect outcomes after stroke in children, but further studies are needed to better understand this relationship.
The estimation of SES is complex. Rural residence may not equal low SES. Maternal education is often used as a proxy of the child's SES, but that may not have the same implications as in adults because parents may prioritize their children's health care over their own. The strong association between very low income and poor outcome is impressive because there were only 50 children in the lowest income category. In the 4 highest-income countries, only 26 of 253 children were in the lowest income category. Unfortunately, we had too few cases from LAMI countries to dissect the relationship among low income compared with developed countries, low income as a reflection of low SES, and poststroke outcomes.
The large prospective nature of the VIPS study provides a unique opportunity to compare outcomes with other recently reported childhood AIS cohorts.23–25 Similar neurologic outcomes were found in a British study10 and a Canadian stroke registry.26 Differing from our cohort, the Canadian and the UK studies found that seizure at onset of AIS was associated with poor outcome.10 In a Swiss study, longer-term outcomes were assessed at a median of 6.9 years27; a normal outcome was found in 27% of children, and 28% had mild impairments. While there are challenges in comparing pediatric stroke studies in terms of how and when outcomes are measured,26 ≈50% of children had no or mild neurologic impairments at ≥1 year after incident stroke. None of these studies formally assessed cognition, and markers of SES were not collected in the other 3 childhood AIS studies discussed.
Our work has limitations. SES was measured solely through parental report. We collected only a few markers of SES; additional measures of SES may be important for children. We were unable to adjust income to account for economic differences across countries where sites were located, and a low income may not correlate with poverty to the same extent in LAMI as in non-LAMI countries. The study was underpowered to detect a clinically significant difference between outcome and LAMI countries. We did not reliably measure initial stroke severity via the Pediatric NIH Stroke Scale,28 and we did not have infarct volume adjusted for brain volume, which is necessary in children. Our questionnaire did not assess the amount of rehabilitation that children received at 12 months, merely whether they were receiving services at that time.
Income, 1 marker of SES, is associated with outcome 1 year after stroke in children in the highest and lowest income groups in a large multinational cohort. However, the root causes of poorer outcome for children with very low income are not clear. Socioeconomic disparities in incident childhood AIS and in outcome deserve further investigation.
Glossary
- AIS
arterial ischemic stroke
- CI
confidence interval
- IQR
interquartile range
- LAMI
lower- and middle-income
- OR
odds ratio
- PSOM
Pediatric Stroke Outcome Measure
- RRQ
Pediatric Stroke Recovery and Recurrence Questionnaire
- SES
socioeconomic status
- VIPS
Vascular Effects of Infection in Pediatric Stroke
Contributor Information
Collaborators: VIPS Investigators, Michael M. Dowling, Susan L. Benedict, Timothy J. Bernard, Christine K. Fox, Gabrielle A. deVeber, Neil R. Friedman, Warren D. Lo, Rebecca N. Ichord, Marilyn A. Tan, Mark T. Mackay, Adam Kirton, Marta Hernandez-Chavez, Peter Humphreys, Lori C Jordan, Sally M Sultan, Michael J. Rivkin, Mubeen Rafay, Luigi Titomanlio, Gordana Kovacevic, Jerome Yager, Catherine Amlie-Lefond, Nomazulu Dlamini, John Condie, Ann Yeh, Rachel Kneen, Bruce Bjornson, Paola Pergami, Li Ping Zou, Jorina Elbers, Abdalla Abdalla, Anthony K. Chan, Osman Farooq, Mingming Lim, Jessica L. Carpenter, Steven Pavlakis, Virginia Wong, and Robert Forsyth
Author contributions
Lori C. Jordan: drafting of the work; acquisition, analysis, or interpretation of data; critical revision of the manuscript for important intellectual content; study supervision. Nancy K. Hills: statistical analysis; acquisition, analysis, or interpretation of data; critical revision of the manuscript for important intellectual content. Christine K. Fox: drafting of the manuscript; acquisition, analysis, or interpretation of data; critical revision of the manuscript for important intellectual content. Rebecca N. Ichord and Paola Pergami; acquisition, analysis, or interpretation of data; critical revision of the manuscript for important intellectual content. Gabrielle A. deVeber: obtained funding; study concept and design; acquisition, analysis, or interpretation of data; critical revision of the manuscript for important intellectual content. Heather J. Fullerton: obtained funding; study concept and design; acquisition, analysis, or interpretation of data; critical revision of the manuscript for important intellectual content; study supervision. Warren Lo: drafting of the manuscript; acquisition, analysis, or interpretation of data; critical revision of the manuscript for important intellectual content; study supervision. Dr. Fullerton and Dr. Jordan had full access to all the data in the study and take responsibility for the integrity of the data and the accuracy of the data analysis.
Study funding
This work was funded by NIH R01 NS062820 (Fullerton/deVeber) and the Benioff Pediatric Stroke and Neurovascular Research Fund.
Disclosure
The authors report no disclosures relevant to the manuscript. Go to Neurology.org/N for full disclosures.
References
- 1.Bettger JP, Zhao X, Bushnell C, et al. The association between socioeconomic status and disability after stroke: findings from the Adherence eValuation after Ischemic stroke Longitudinal (AVAIL) registry. BMC Public Health 2014;14:281. [DOI] [PMC free article] [PubMed] [Google Scholar]
- 2.Cox AM, McKevitt C, Rudd AG, Wolfe CD. Socioeconomic status and stroke. Lancet Neurol 2006;5:181–188. [DOI] [PubMed] [Google Scholar]
- 3.Kerr GD, Higgins P, Walters M, et al. Socioeconomic status and transient ischaemic attack/stroke: a prospective observational study. Cerebrovasc Dis 2011;31:130–137. [DOI] [PubMed] [Google Scholar]
- 4.Jakovljevic D, Sarti C, Sivenius J, et al. Socioeconomic status and ischemic stroke: the FINMONICA Stroke Register. Stroke 2001;32:1492–1498. [DOI] [PubMed] [Google Scholar]
- 5.Li C, Hedblad B, Rosvall M, Buchwald F, Khan FA, Engstrom G. Stroke incidence, recurrence, and case-fatality in relation to socioeconomic position: a population-based study of middle-aged Swedish men and women. Stroke 2008;39:2191–2196. [DOI] [PubMed] [Google Scholar]
- 6.Arrich J, Lalouschek W, Mullner M. Influence of socioeconomic status on mortality after stroke: retrospective cohort study. Stroke 2005;36:310–314. [DOI] [PubMed] [Google Scholar]
- 7.Fullerton HJ, Hills NK, Elkind MS, et al. Infection, vaccination, and childhood arterial ischemic stroke: results of the VIPS study. Neurology 2015;85:1459–1466. [DOI] [PMC free article] [PubMed] [Google Scholar]
- 8.Engelmann KA, Jordan LC. Outcome measures used in pediatric stroke studies: a systematic review. Arch Neurol 2012;69:23–27. [DOI] [PMC free article] [PubMed] [Google Scholar]
- 9.Ganesan V, Ng V, Chong WK, Kirkham FJ, Connelly A. Lesion volume, lesion location, and outcome after middle cerebral artery territory stroke. Arch Dis Child 1999;81:295–300. [DOI] [PMC free article] [PubMed] [Google Scholar]
- 10.Mallick AA, Ganesan V, Kirkham FJ, et al. Outcome and recurrence one year after paediatric arterial ischaemic stroke in a population-based cohort. Ann Neurol 2016;79:784–793. [DOI] [PubMed] [Google Scholar]
- 11.Nasiri J, Ariyana A, Yaghini O, Ghazavi MR, Keikhah M, Salari M. Neurological outcome after arterial ischemic stroke in children. Adv Biomed Res 2016;5:107. [DOI] [PMC free article] [PubMed] [Google Scholar]
- 12.Yusuf S, Rangarajan S, Teo K, et al. Cardiovascular risk and events in 17 low-, middle-, and high-income countries. N Engl J Med 2014;371:818–827. [DOI] [PubMed] [Google Scholar]
- 13.Fullerton HJ, Elkind MS, Barkovich AJ, et al. The Vascular Effects of Infection in Pediatric Stroke (VIPS) Study. J Child Neurol 2011;26:1101–1110. [DOI] [PMC free article] [PubMed] [Google Scholar]
- 14.Elkind MS, Hills NK, Glaser CA, et al. Herpesvirus infections and childhood arterial ischemic stroke: results of the VIPS study. Circulation 2016;133:732–741. [DOI] [PMC free article] [PubMed] [Google Scholar]
- 15.Kitchen L, Westmacott R, Friefeld S, et al. The pediatric stroke outcome measure: a validation and reliability study. Stroke 2012;43:1602–1608. [DOI] [PubMed] [Google Scholar]
- 16.Lo WD, Ichord RN, Dowling MM, et al. The Pediatric Stroke Recurrence and Recovery Questionnaire: validation in a prospective cohort. Neurology 2012;79:864–870. [DOI] [PMC free article] [PubMed] [Google Scholar]
- 17.Beslow LA, Licht DJ, Smith SE, et al. Predictors of outcome in childhood intracerebral hemorrhage: a prospective consecutive cohort study. Stroke 2010;41:313–318. [DOI] [PMC free article] [PubMed] [Google Scholar]
- 18.Beslow LA, Smith SE, Vossough A, et al. Hemorrhagic transformation of childhood arterial ischemic stroke. Stroke 2011;42:941–946. [DOI] [PMC free article] [PubMed] [Google Scholar]
- 19.Psaki SR, Seidman JC, Miller M, et al. Measuring socioeconomic status in multicountry studies: results from the eight-country MAL-ED study. Popul Health Metrics 2014;12:8. [DOI] [PMC free article] [PubMed] [Google Scholar]
- 20.Hong J, Lee B, Ha EH, Park H. Parental socioeconomic status and unintentional injury deaths in early childhood: consideration of injury mechanisms, age at death, and gender. Accid Anal Prev 2010;42:313–319. [DOI] [PubMed] [Google Scholar]
- 21.Wintermark M, Hills NK, deVeber GA, et al. Arteriopathy diagnosis in childhood arterial ischemic stroke: results of the Vascular Effects of Infection in Pediatric Stroke study. Stroke 2014;45:3597–3605. [DOI] [PMC free article] [PubMed] [Google Scholar]
- 22.HealthCare.Gov. The Children's Health Insurance Program (CHIP) [online]. Available at: healthcare.gov/medicaid-chip/childrens-health-insurance-program/. Accessed September 1, 2017. [Google Scholar]
- 23.Lanthier S, Carmant L, David M, Larbrisseau A, de Veber G. Stroke in children: the coexistence of multiple risk factors predicts poor outcome. Neurology 2000;54:371–378. [DOI] [PubMed] [Google Scholar]
- 24.Fullerton HJ, Wu YW, Zhao S, Johnston SC. Risk of stroke in children: ethnic and gender disparities. Neurology 2003;61:189–194. [DOI] [PubMed] [Google Scholar]
- 25.Fox CK, Johnston SC, Sidney S, Fullerton HJ. High critical care usage due to pediatric stroke: results of a population-based study. Neurology 2012;79:420–427. [DOI] [PMC free article] [PubMed] [Google Scholar]
- 26.deVeber GA, Kirton A, Booth FA, et al. Epidemiology and outcomes of arterial ischemic stroke in children: the Canadian Pediatric Ischemic Stroke Registry. Pediatr Neurol 2017;69:58–70. [DOI] [PubMed] [Google Scholar]
- 27.Goeggel Simonetti B, Cavelti A, Arnold M, et al. Long-term outcome after arterial ischemic stroke in children and young adults. Neurology 2015;84:1941–1947. [DOI] [PubMed] [Google Scholar]
- 28.Ichord RN, Bastian R, Abraham L, et al. Interrater reliability of the Pediatric National Institutes of Health Stroke Scale (PedNIHSS) in a multicenter study. Stroke 2011;42:613–617. [DOI] [PMC free article] [PubMed] [Google Scholar]
Associated Data
This section collects any data citations, data availability statements, or supplementary materials included in this article.
Data Availability Statement
Data available from Dryad (tables 1–3, doi:10.5061/dryad.vp34f2q). Anonymized data will be shared by request from any qualified investigator.


