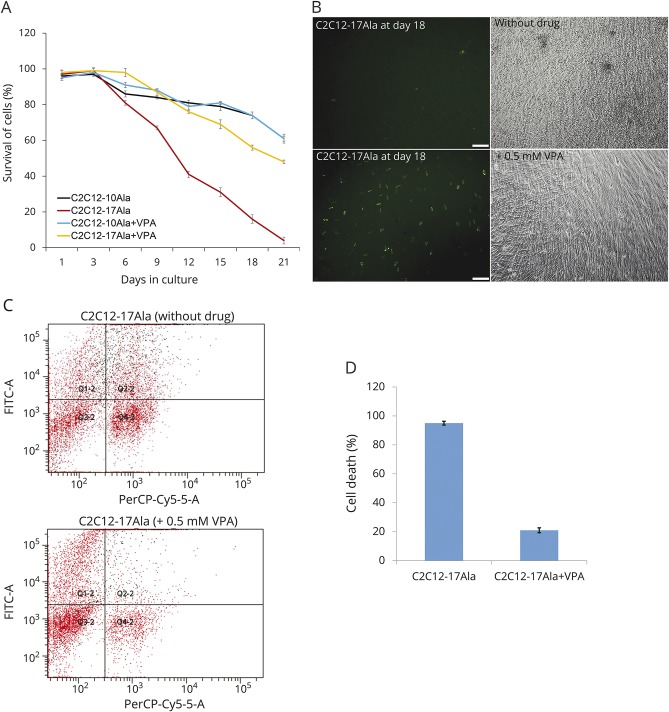
Figure 2. VPA is protective for OPMD.
(A) Percentage of cell survival was determined by live-stage microscopy at different days. VPA-treated C2C12-17Ala shows a striking increased in the percentage of cell survival compared to nontreated C2C12-17Ala at different time points (mean ± SE, *p < 0.001 vs nontreated samples) (analysis of variance). This increase seems to be specific to C2C12-17Ala as C2C12-10Ala did not exhibit any change in cell survival after VPA treatment. After they were seeded, cells were counted every 24 hours for 21 consecutive days using the live-stage microscope. Cell survival was quantified using Volocity software (PerkinElmer, Waltham, MA). The percentage of transfected living cells represents the variation of the amount of transfected living cells at different time points compared with the number of transfected cells obtained on day 1. (B) A positive effect of VPA on the morphology of C2C12-17Ala at later stage of treatment. Cells treated with 0.5 mM VPA are more proliferative, differentiated, and look healthier than the nontreated samples. Both fluorescent and phase contrast microscopy images were captured on day 18 of treatment. (C) A 2-color FACS dotplot from a representative experiment in which the C2C12-17Ala were treated with 0.5 mM VPA compared with nontreated cells, stained with 7-AAD to label dead cells, and cosorted for GFP (green) and 7-AAD (red) fluorescence. Grid lines were positioned after calibrating the flow cytometry. Upper right quadrants signify 7-AAD–labeled dead or dying transfected cells (GFP+, 7-AAD+), i.e., Q2-2. The experiment was performed on day 18 post drug treatment and repeated 3 times. (D) VPA significantly rescues C2C12-17Ala–associated cell death as assessed by FFC. Quantification of cell death measured by FFC. Percentage of cell death on day 18 was calculated by dividing the number of 7-AAD–stained transfected GFP C2C12 cells over the total number of transfected cells. The experiment was performed on day 18 post drug treatment and repeated 3 times (*p < 0.001 versus nontreated cells). 7-AAD = 7-amino actinomycin D; FACS = fluorescence-activated cell sorting; FFC = fluorescence flow cytometry; FITC = fluorescein isothiocyanate; GFP = green fluorescent protein; OPMD = oculopharyngeal muscular dystrophy; VPA = valproic acid.

