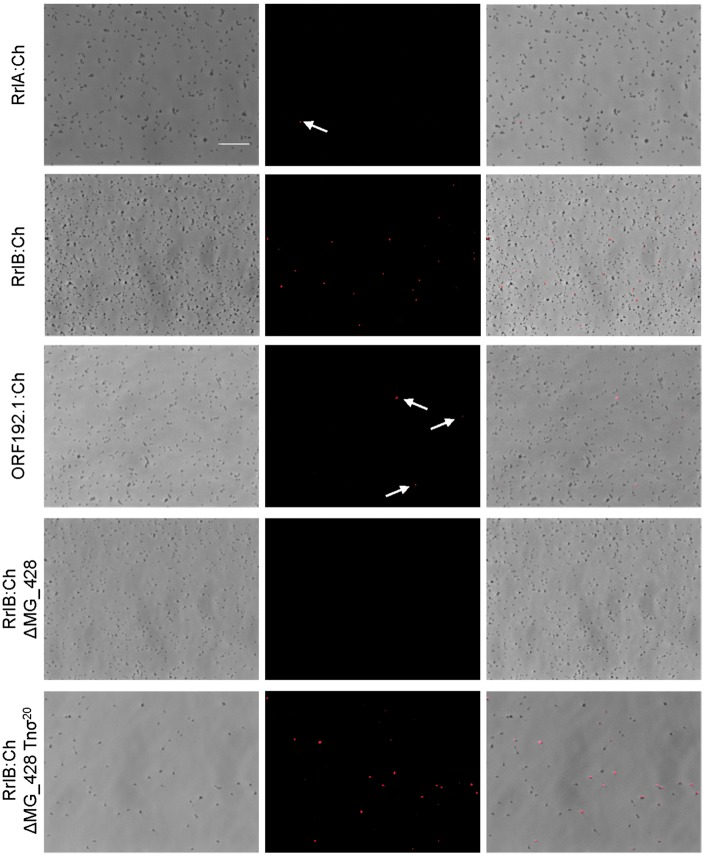
Figure 2.
Single cell analysis of RrlA, RrlB and ORF192.1 expression in different mutant backgrounds. Each row contains a series of three fluorescence microscopy images corresponding to the phase contrast, the TRITC channel and the resulting overlay of the different mutants analysed. White arrows indicate the presence of mCherry fluorescent cells in strains where fluorescence is rare. Scale bar is 10 µm.

