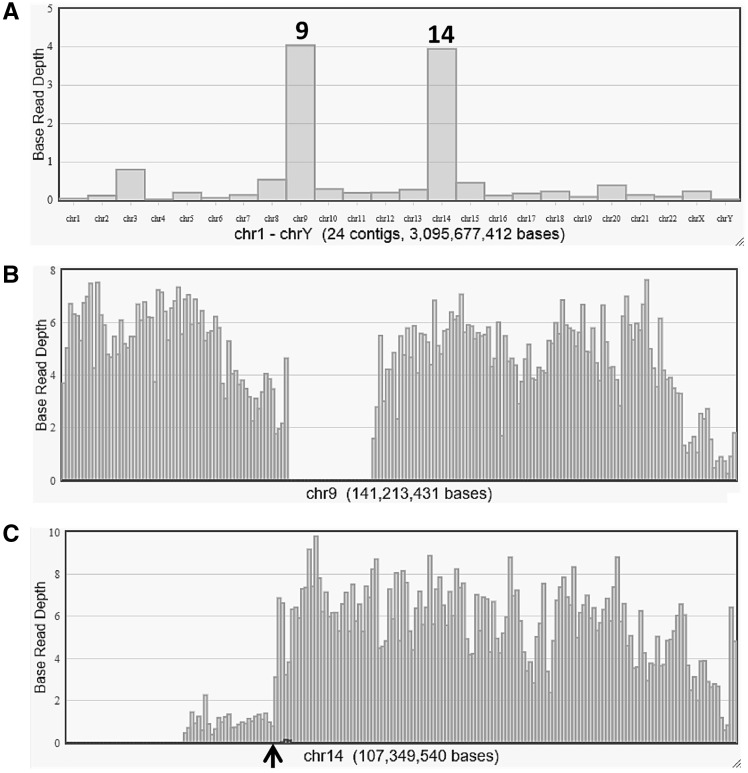
Figure 2.
Reference coverage charts from chromosome sequencing of der(9) are shown based on average base read depth. (A) Coverage on each chromosome indicates its contents aligned to chromosomes 9 and 14, with some sequences mapped to chromosome 3 because of contamination from the closely located peak in the flow karyotype. (B) Sequence reads are detected along chromosome 9, with a large gap at the region of the centromere and pericentromeric heterochromatin. (C) The majority of reads appear in the 14q13-qter region, which indicates the breakpoint at 14q13.1 shown by an arrowhead.

