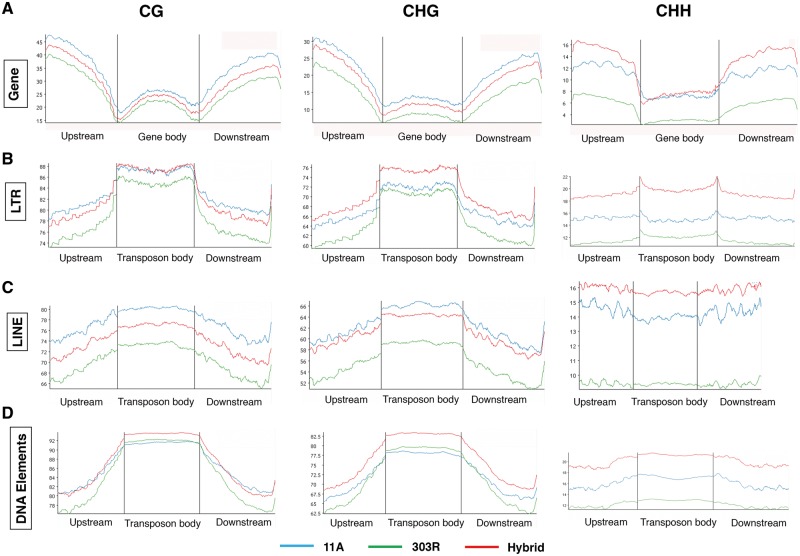
Figure 2.
Distribution of methyl cytosines in genes and transposable elements in pigeonpea. (A) Line plots showing methylation level in 2Kb flanking (upstream and downstream) and within the gene body in 11A, 303R and F1 hybrid in CG, CHG and CHH contexts. (B–D) Line plots showing methylation level in 2Kb flanking (upstream and downstream) and within the gene body of transposons- long terminal repeats (B); LINE (C) and DNA Elements (D) in 11A, 303R and F1 hybrid in CG, CHG and CHH context. Note higher mCs throughout the transposons compared to genes (Colored figure is available in the online version of the article).

