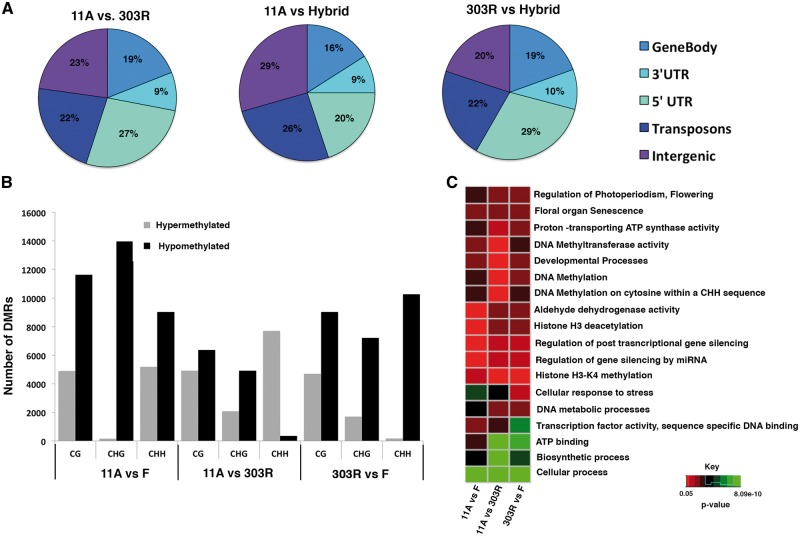
Figure 3.
Comparative analyses of DMRs between the inbred lines and their hybrid. (A) Pie charts showing the distribution of DMRs in the different genomic regions in 11A vs. 303R, 11A vs. hybrid and 303R vs. hybrid. (B) A bar plot showing number of hypo and hypermethylated CG, CHG and CHH DMRs in 11A vs. 303R, 11A vs. hybrid and 303R vs. hybrid. (C) A heat map showing enrichment of DMR associated genes in 11A vs. 303R, 11A vs. hybrid and 303R vs. hybrid. Color code represents low to high P-values (0.05 to 8.09e-10) (Colored figure is available in the online version of the article).

