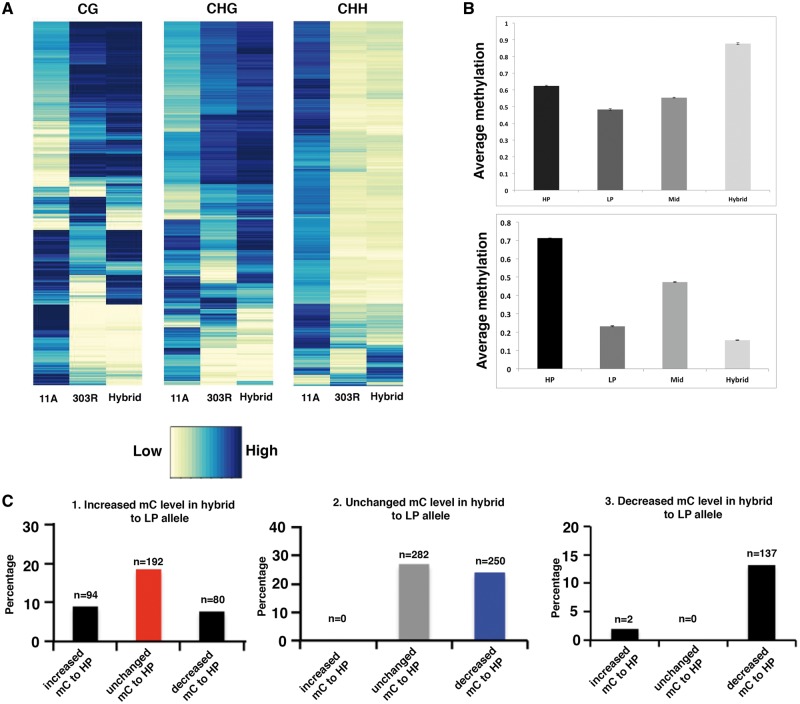
Figure 4.
(A) Heat maps showing the methylation status of DMRs of the parents and methylation pattern at those loci in the F1 hybrid. Note in all the mCs context, methylation patterns of F1 hybrid are similar to the fertile parent (303 R) and different to the sterile parent. (B) Bar plot showing non-additive methylation in F1 hybrid. Note increased average methylation in hybrid than the MPV in the upper graph indicating the occurrence of TCM. Similarly, note a decreased average methylation in hybrid than the MPV in the lower upper graph indicating TCdM. (C) Bar plots showing changes in parental allelic methylations in the hybrid. Majority of the non-additive methylation occurred through TCdM (Blue). Red bar represent TcM. Methylation levels of most parental alleles remained unchanged in hybrid (gray) (Colored figure is available in the online version of the article). HP: high parent; LP: low parent.

