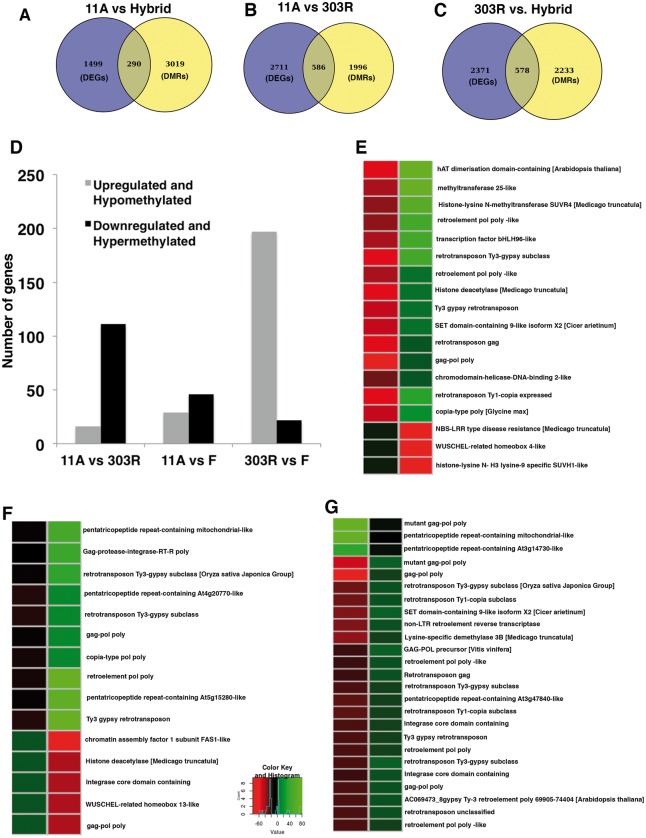
Figure 5.
Characterization of DMRs associated DEGs in pigeonpea. (A–C) Venn diagrams showing unique and common DEGs (differentially expressed genes) to the genes associated with DMRs in 11A vs. hybrid (A), 11A vs. 303R (B) and 303R vs. hybrid (C). (D) Bar plots showing number of DEGs that were differentially methylated in 11A vs. 303R, 11A vs. hybrid and 303R vs. hybrid. (E–G) Heat maps displaying comparative methylation levels of selective genes that showed negative correlation between their expression and methylation in 11A vs. 303R (E), 11A vs. hybrid (F) and 303R vs. hybrid (G). Color code indicates methylation level (0–1) (Colored figure is available in the online version of the article).

