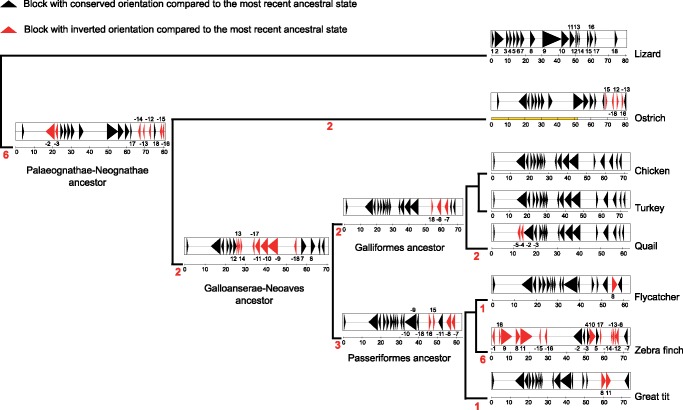
Fig. 3.
—Overview of inferred inversion events on the Z chromosome across avian lineages. Each triangle represents a synteny block, which are regions with conserved gene order across the phylogeny. Blocks are numbered according to their order in lizard, thought to represent the organization in a common lizard-bird ancestor. Numbers in red on each branch indicate the number of inferred inversion events in that lineage. A coloring (orientation) and numbering (order) scheme is used to denote a change in synteny blocks. Synteny blocks retaining the orientation of the most recent ancestor in the phylogeny are shown in black, while those that have been inverted compared to the immediate ancestor are shown in red. The numbering scheme represents the position of the block compared to lizard. Minus signs denote that a block has the opposite orientation compared to lizard. The position and length of synteny blocks in ostrich is used to depict the Palaeognathae-Neognathae ancestor, while data from chicken are used for the Galloanserae-Neoaves and Galliform ancestors, and data from flycatcher are used for Passeriform ancestor; in each case a ruler below the chromosome shows the position in Mb. The yellow ruler under ostrich Z indicates the PAR. Note that the gap between blocks is due to lack of homology between lizard chromosome 2 and avian species in those segments.

