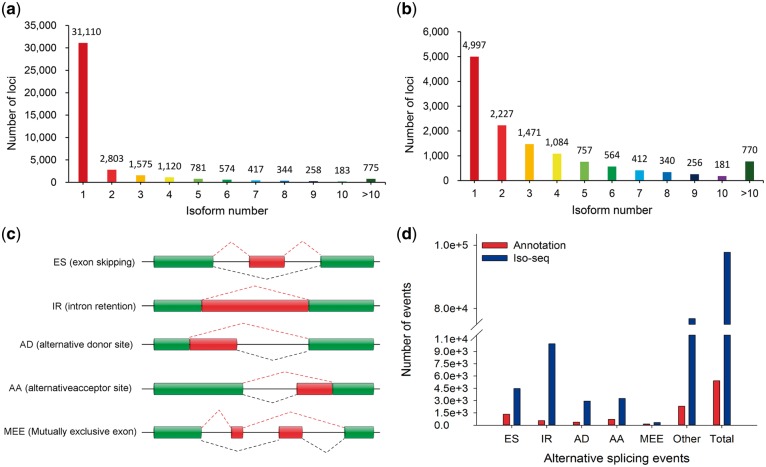
Figure 3.
Distribution of genes that produce splice isoform and AS event with different models. (a) The total number of loci according to isoforms of FLNC in PacBio Iso-deq data. (b) Annotated loci and isoforms were based on FLNC mapped to reference genome. (c) Five basic models of AS: exon skipping, intron retention, alternative donor site, alternative acceptor site and mutually exclusive exons. (d) The total number of AS events in genes based on Iso-seq data compared with the annotated gene models.

