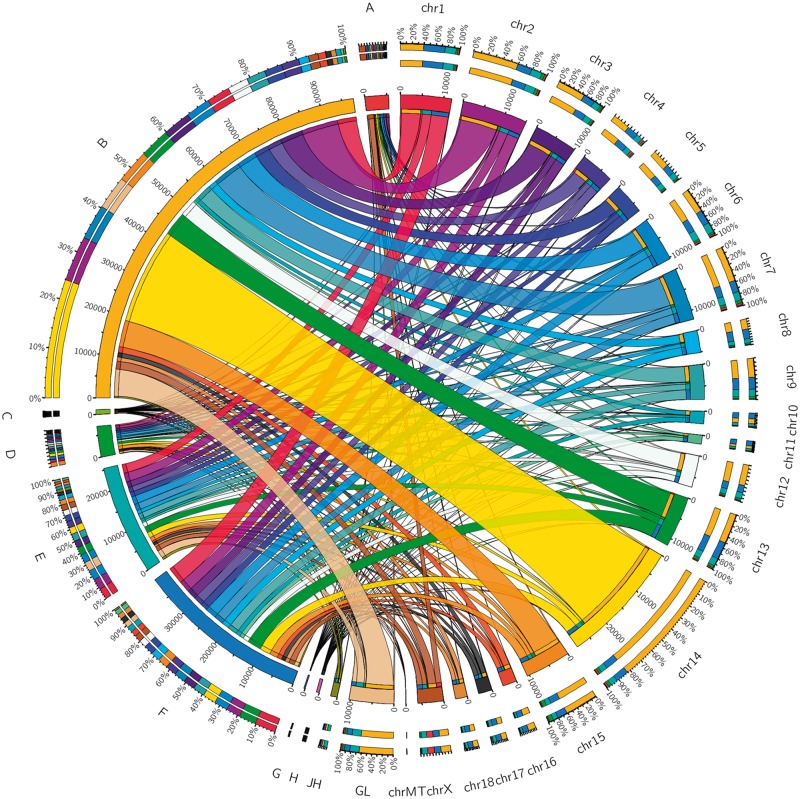
Figure 5.
Distributed visualization using Circos of different data at chromosome level. The total length of the half circle corresponding to each label is the sum of all the values corresponding to the label. The connection between the different half circles indicates the value expressed by the two tags. A and B represent the number distribution of AS events in reference annotation and Iso-seq data, respectively. C and D correspond to number distribution of AS models in reference annotation and Iso-seq data, respectively. E and F exhibit number of gene in annotation and Iso-seq data, respectively. G and H denote fusion gene and fusion isoform in Iso-seq data, respectively. Chr represents chromosome; JH and GL represent the scaffolds that have not assembled on the chromosome.

