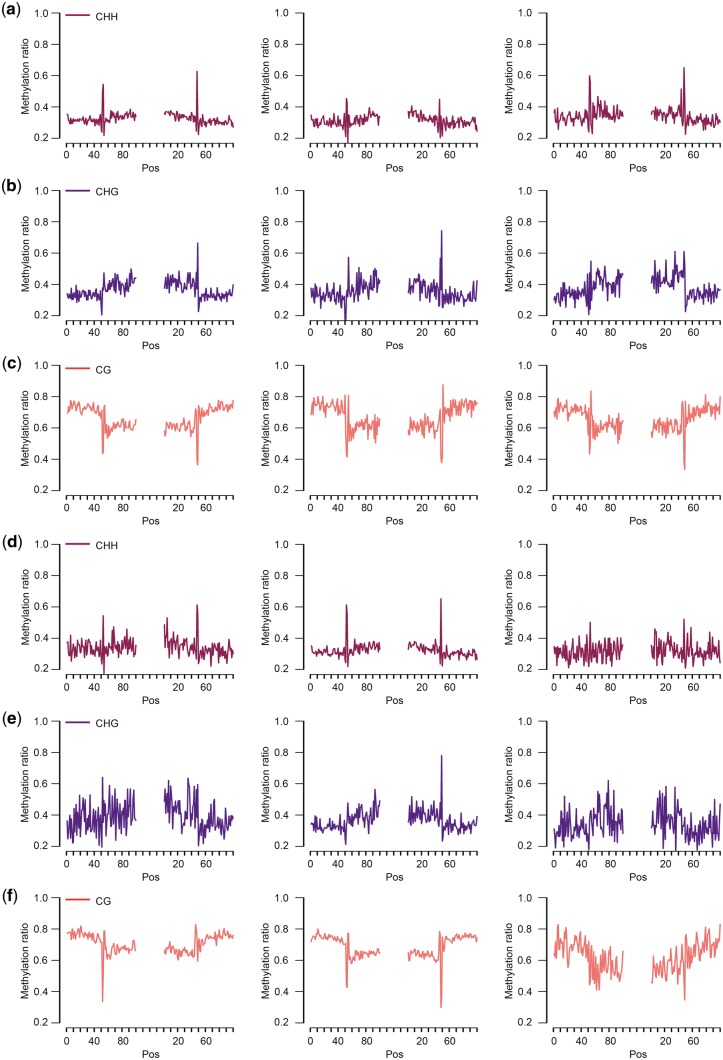
Figure 6.
Level of DNA methylation at splice sites (exon–intron, intron–exon). (a)–(c): For each row, level of DNA methylation, combing sense and antisense strand, on the sense strand, on the antisense strand. (d)–(f): For each row, level of DNA methylation in genes with only one isoform, in all isoforms of genes with 2–10 isoforms, in all isoforms of genes with more than 10 isoforms.

