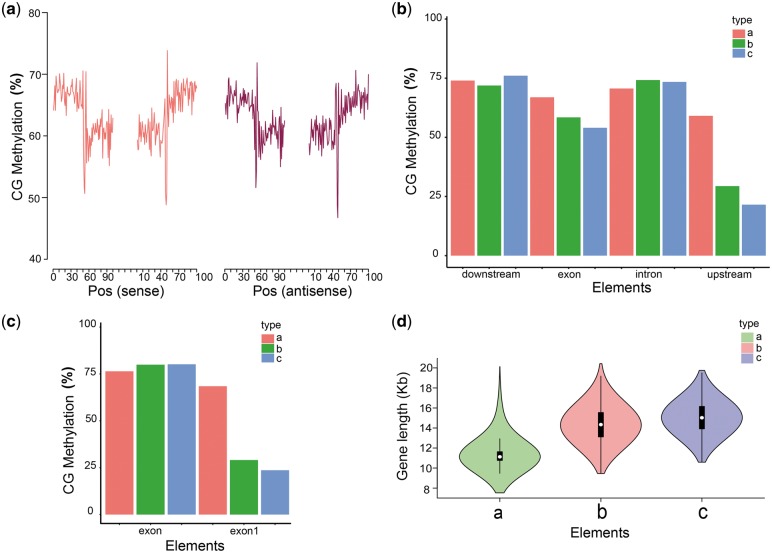
Figure 7.
CG methylation and isoform. (a) Level of CG methylation on the sense strand and antisense strand at splice sites. (b) The relationship between methylation of gene and isoform. (c) Methylation of exon. (exon1: the first exon; exon: other exons excluding the first exon). (d) The relationship between gene length and number of isoform. In (b), (c) and (d), type a: one isoform; type b: 2–10 isoforms; type c: more than 10 isoforms.

