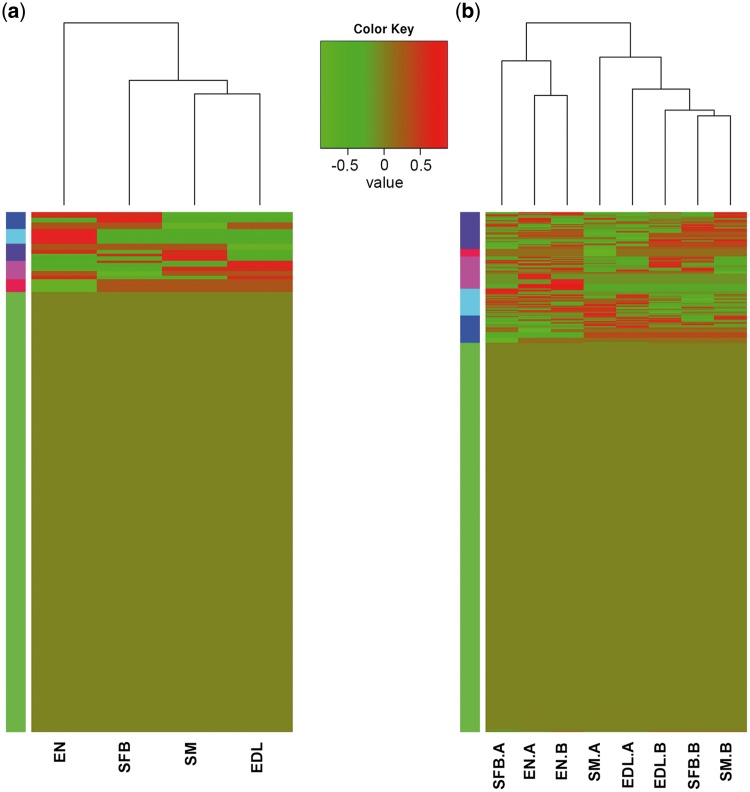
Figure 8.
Heatmap of tissue-specific and period-specific isoforms. (a) Tissue-specific isoforms. (b) Period-specific isoforms. SFB: subcutaneous fat of back, SM: soleus muscle, EDL: extensor digitorum longus, EN: endometria, A: adult, B: birth (one day). The coloured box on the left means the cluster analysis of whole-gene expression levels in eight tissues.

