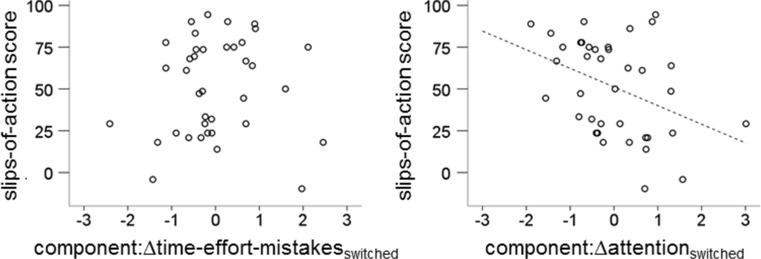
Fig. 5.
Scatterplots of slips-of-action scores and both components extracted from the switched phase difference scores of the key-cover procedure. The left-hand-side plot shows the behavioral automaticity component and the right-hand-side plot the attentional component. Regression lines indicate significant Spearman correlations, ps < .05

