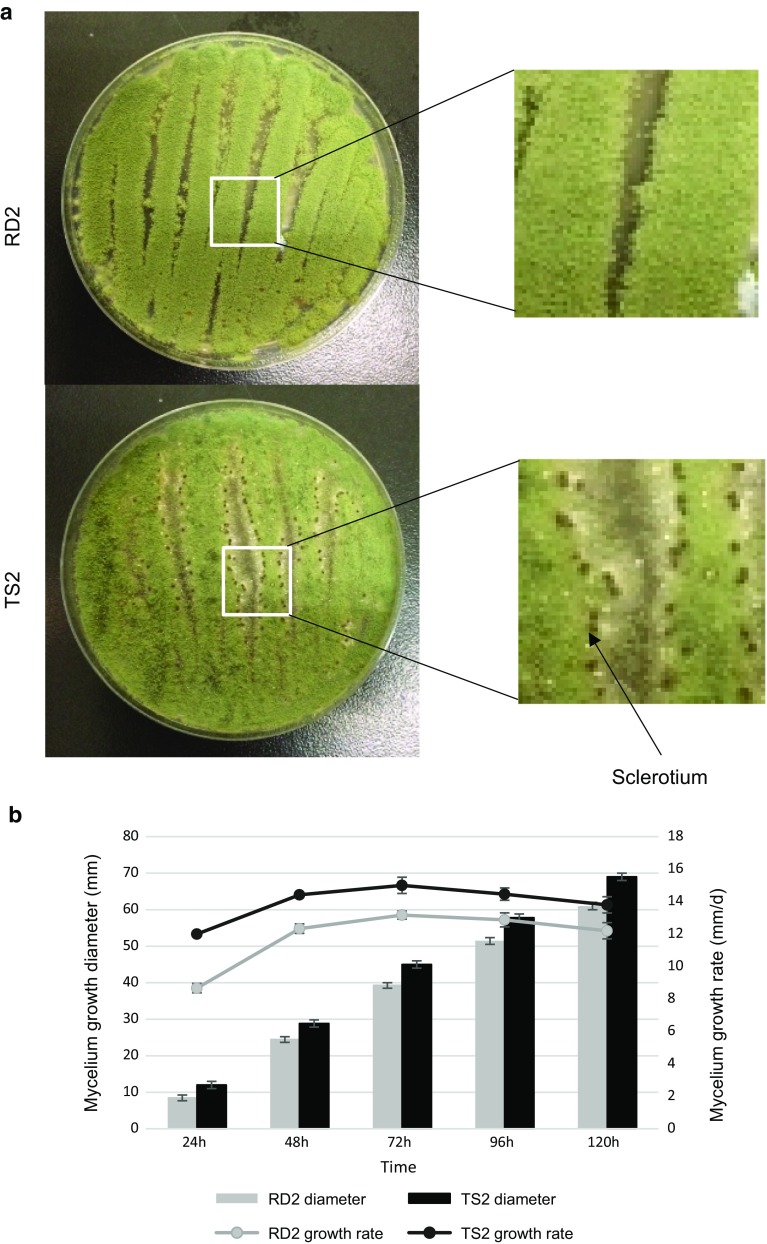
Fig. 1.
Growth phenotypes of RD2 and TS2 on PDA plates. a RD2 and TS2 grown after 72 h. The arrow indicates a sclerotium (dark spot) produced by TS2. b Mycelium growth diameter and growth rate of RD2 and TS2. Data are presented as mean ± standard deviation. Significant difference was detected between RD2 and TS2 in all days (P < 0.01, Student’s t test)

