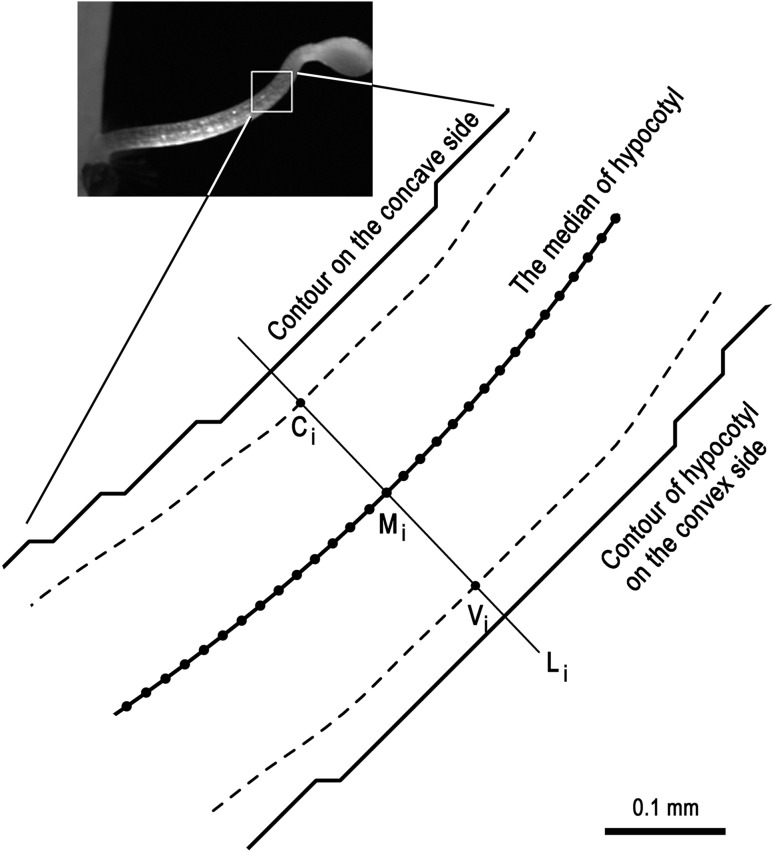
Fig. 1.
Schematic representation of measurement of luminescence intensity along the hypocotyl. The bold lines show the median of hypocotyl and the hypocotyl surface contours on the concave and convex sides. The broken lines are smoothed lines that are located 1/8 of the hypocotyl diameter inside from the contour lines. Points Mi are set on the median of the hypocotyl at 19.9-µm interval from the base to the tip. Line Li is normal to the median at Mi. Ci and Vi are intersection points between Li and the smoothed, internal line on the concave side and the convex side, respectively. Luminescence intensity was measured at Ci, Mi and Vi, and is referred to as L c, L m and L v, respectively. Inset shows a hypocotyl 1.36 h after turning to the horizontal in Fig. 2

