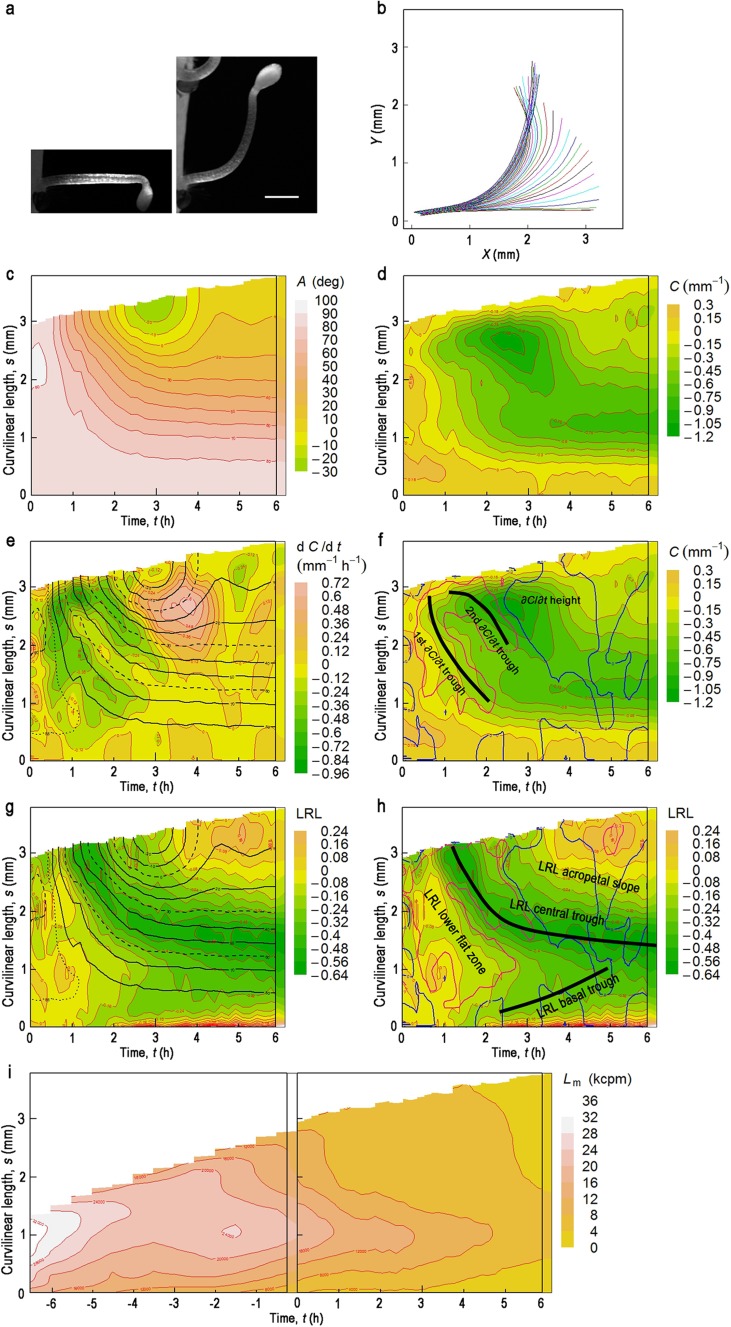
Fig. 2.
Gravitropic response of an etiolated hypocotyl harboring pIAA19:ELuc-PEST, with cotyledons facing downwards. Contour maps in (c–h) are drawn from the data shown in (b). a The examined hypocotyl at t = 0 (left) or 6.10 h (right) after turning to the horizontal in darkness. Bar = 1 mm. b Change in the median position of the hypocotyl after turning through 90°. Measurements were made at 0.170-h intervals over 6.10 h, in darkness. Successive positions of the median are shown in different colors, in the order of black, red, green, blue, cyan, and magenta. c A contour map of the deflection angle (A) in the t–s plane. d A contour map of curvature (C) in the t–s plane. e A contour map of in the t–s plane (Fig. S1) superimposed with the contour lines of A (c) at 10° intervals (black solid line). Contour lines of 0°, 30°, 60° and 90° are drawn as a broken line; that of 85° as a dotted line. f The C map with topographic characteristics of the map (Fig. 2e). Red and blue lines are the contour lines of = −0.3 and 0, respectively, from Fig. 2e. Thick black lines show troughs of . g A contour map of the logarithm of the ratio of luminescence of the concave side to that of the convex side (log10(L c/L v); LRL) in the t–s plane, superimposed with contour lines of A in the same fashion as in (e). h The LRL map with topographic characteristics and contour lines of = −0.2 (red) and 0 (blue) from (e). Thick black lines show troughs of LRL. i A contour map of luminescence intensity along the median of hypocotyl (L m) in the t–s plane. At time 0, a hypocotyl was turned by 90°

