Fig. 4.
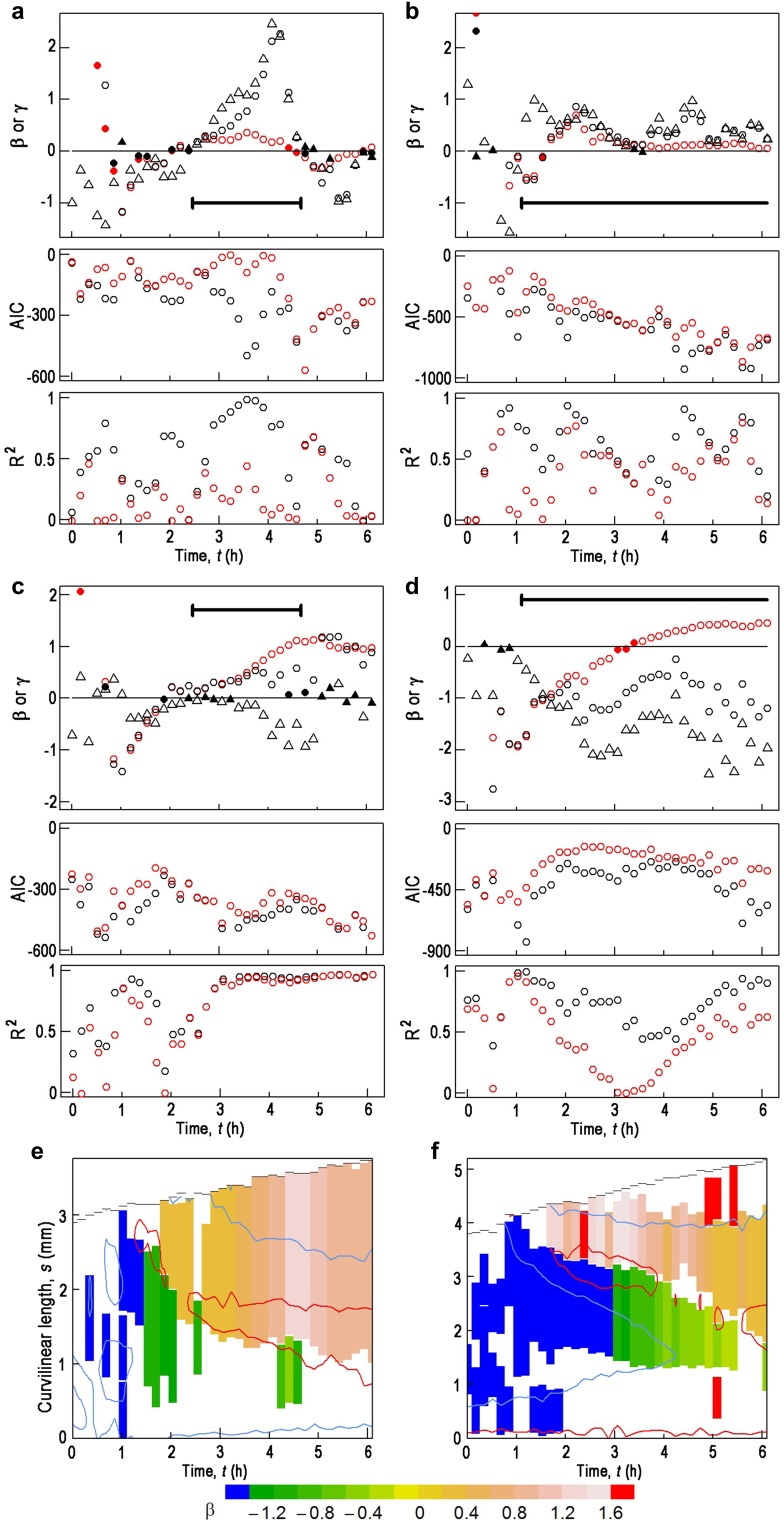
Parameters of the graviproprioception (GP) model and the sine-law model estimated for the hypocotyls in Figs. 2, 3 at each observed time point after turning through 90°. a, b Parameters estimated for from hypocotyls with downward (a) and upward (b)-facing cotyledons, respectively. In the top panels, for the GP model, β = black circle and γ = black triangle; for the sine-law model, β = red circle. Solid symbols mean that their values are not significantly different from 0 (P > 0.05). Thick horizontal lines indicate the time period when autostraightening occurred in Figs. 2e, 3e. In the middle and bottom panels, the Akaike information criterion (AIC) and the adjusted R2 are shown, respectively, for the GP model (black) and the sine-law model (red). Parameters were estimated for the apical portions of hypocotyls of which s was longer than 1.14 mm for a, and 1.33 mm for b. Some of the values of β and γ at t < 0.7 h fall outside of the area of these plots, and thus are shown in Fig. S6. c, d Parameters estimated for LRL from the same hypocotyls as in a and b, respectively. LRL was modeled after the GP and the sine-law models, and parameters are shown as in (a, b). For more details, see legend to a and b. Some of the values of β and γ at t < 0.9 h fall outside of the area of these plots, and thus are shown in Fig. S7. e, f A time–space map of β for the sine-law model for LRL from the same hypocotyls as in a and b, respectively. Segments of hypocotyls which were longer than 0.76 mm, and in which their LRL followed the sine-law model with R2 > 0.95, are shown as a t‒s map (see Fig. S8 for an example). Such segments are colored according to β as shown in the color key, which is common to (e) and (f). These maps are superimposed with contour lines of LRL = −0.48 (red) and 0 (light blue) in (e), and LRL = −0.225 (red) and 0 (light blue) in (f), respectively

