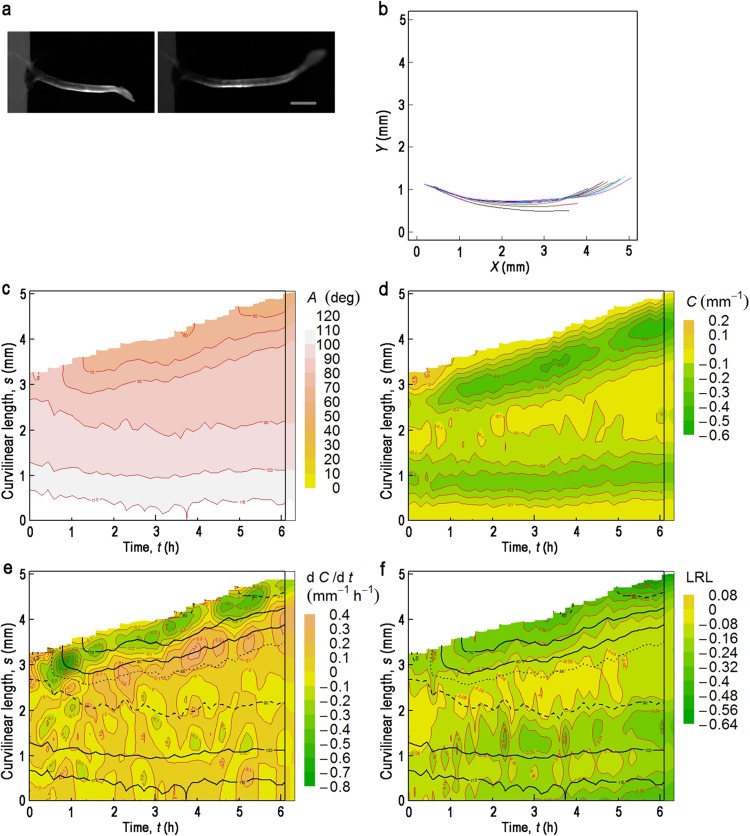
Fig. 5.
Gravitropic response of an etiolated msg2-1 hypocotyl harboring pIAA19:ELuc-PEST. Contour maps are drawn from the data obtained at 0.144-h intervals over a period of 6.33 h after turning through 90° in darkness. a The examined hypocotyl at t = 0 (left) or 6.33 h (right) after turning to the horizontal in darkness. Bar = 1 mm. b Change in the median position of the hypocotyl after turning through 90° at 0.575-h intervals over 6.33 h. Successive positions of the median are shown in different colors, in the order of black, red, green, blue, cyan, and magenta. c‒f Contour maps of deflection angle (A) (c), curvature (C) (d), (e), and LRL (f) in the t–s plane. In e and f, contour lines of A are superimposed: contour lines of 60° and 90° are drawn as broken lines; 85° as a dotted line, and the other contour lines from 70° to 110° as black solid lines

