
Fig. 4. Acute sleep loss induces tissue-specific changes in clock genes and downstream pathways in healthy young men.
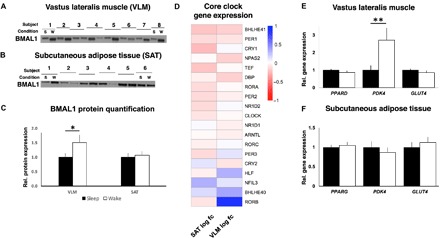
Representative blots for protein abundance of BMAL1 in (A) skeletal muscle (VLM; P = 0.017; showing 8 representative pairs out of a total of 13 analyzed pairs) and in (B) SAT (P = 0.51; 6 representative pairs out of 11 analyzed pairs shown), (C) with quantification, after a night of sleep (s) and a night of sleep loss (wake or w). Western blots were normalized to loading control (see fig. S4, B and C; expression shown relative to controls that were set to 1). (D) Transcriptomic changes in core circadian clock genes, with log2 fold change for each of the investigated tissues (VLM and SAT, n = 15 pairs for each tissue), after sleep loss (wake) compared with after normal sleep (all FDR > 0.05). (E and F) Relative gene expression of targeted genes based on qPCR (PDK4: P = 0.007; all other P > 0.10, n = 15 pairs for each tissue). BMAL1, brain and muscle Arnt-like protein-1; GLUT4, glucose transporter 4; PDK4, pyruvate dehydrogenase kinase isozyme 4; PPARD/PPARG, peroxisome proliferator–activated receptor delta (PPARD)/gamma (PPARG); s, sleep; w, wake (sleep loss). *P < 0.05 and **P < 0.05; two-sided t tests.