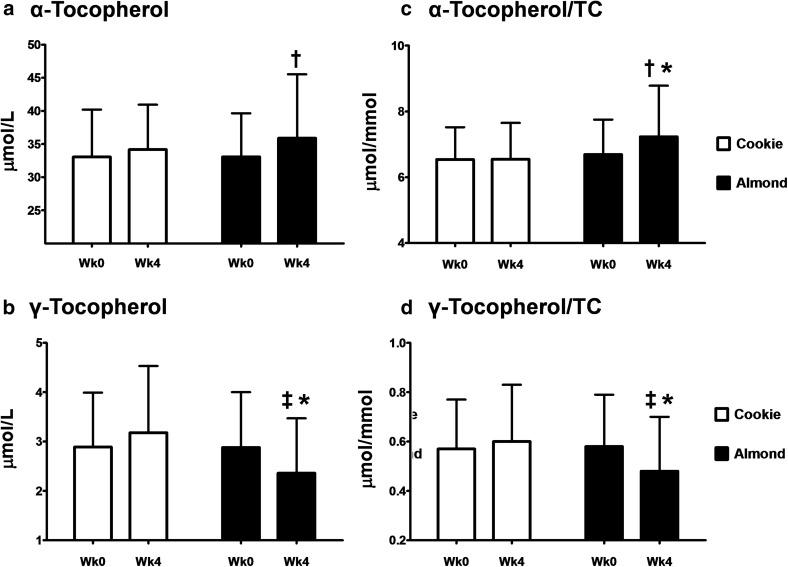
Fig. 3.
Changes in α- (a) and γ-tocopherol (b) and the ratio of tocopherol to total cholesterol (c, d) in subjects consuming either almonds or cookies for 4 weeks. Data are expressed as mean ± SD. † P ≤ 0.05 and ‡ P ≤ 0.01, means within each treatment differ between pre- and post-intervention values, tested by Student’s t test. *P ≤ 0.001, post-intervention means differ between almonds and cookies, tested using the mixed model

