
Figure 1. PFA ependymomas comprise two subgroups and nine subtypes.
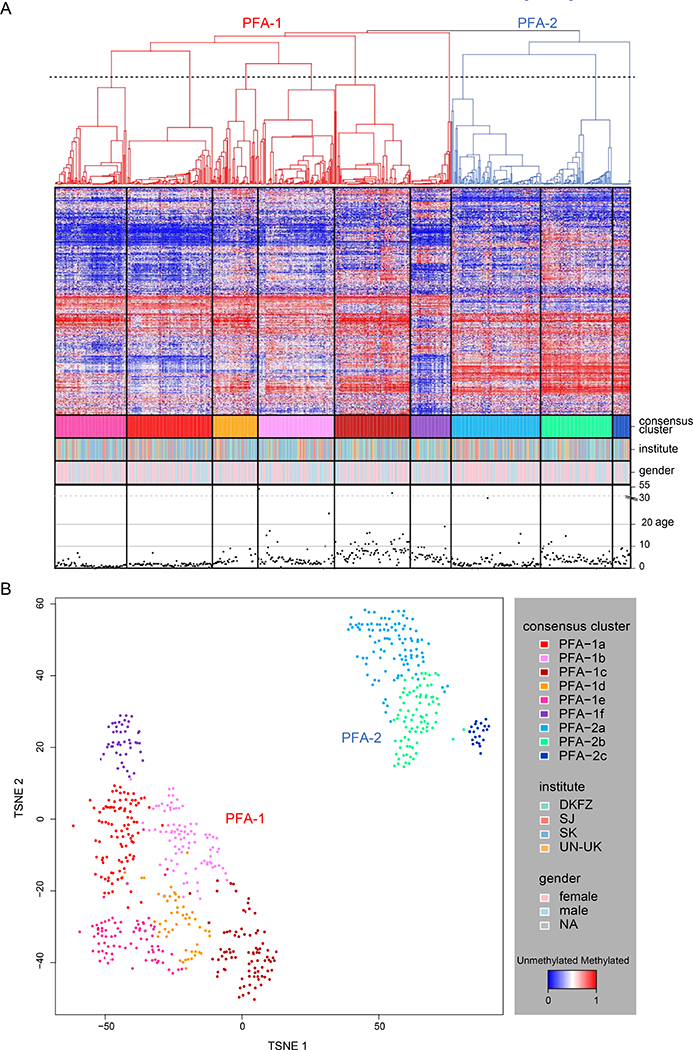
(A) Heat map representation of an unsupervised consensus hierarchical clustering of DNA methylation profiles from 675 PFA ependymomas using the 5000 most differentially methylated probes across all tumors. Each row represents a probe, and each column represents a sample. The level of DNA methylation (beta-value) is represented by a red-blue color scale, as depicted in the key (lower right). For each sample, subtype association, institutional origin, gender, and patient age (years) are provided in four rows below the heat map. Dendrograms related to the two subgroups, PFA-1 and PFA-2, are depicted in red and blue, respectively. The dotted line transecting the dendrogram represents the cut-off for nine subtypes as established through an analysis of the cumulative distribution function (see Figure S2). (B) TSNE plot of DNA methylation array data from 675 PFA ependymomas. Samples are colored according to their respective consensus cluster affiliation in Figure 1A and as shown in the key at lower right.