
Figure 5. Expression of CXorf67 in PFA ependymomas.
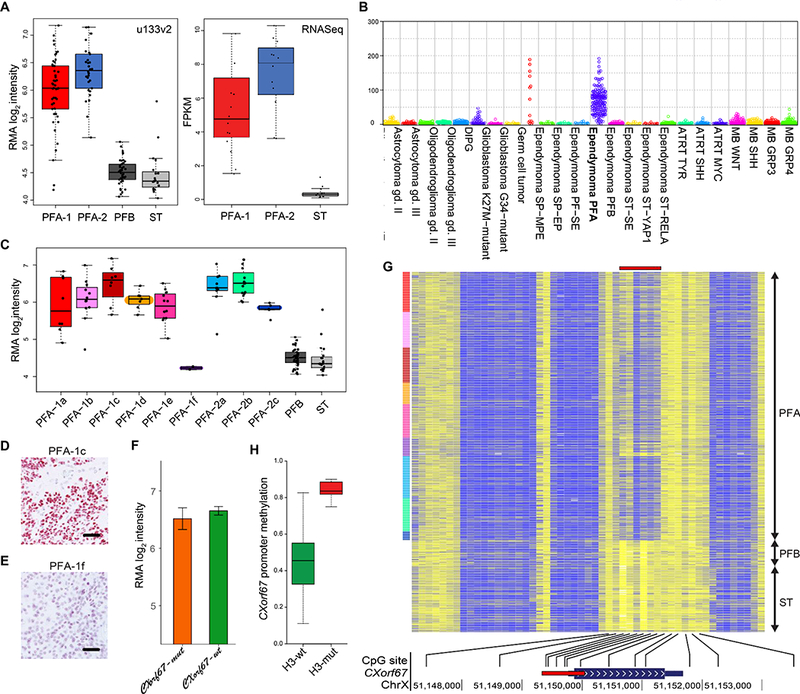
(A) Affymetrix u133v2 array and transcriptome sequencing (RNA-seq) data demonstrating significantly higher CXorf67 expression in PFA than in PFB or supratentorial (ST) ependymomas (Affymetrix u133 data, p=3×10–29 Welch ANOVA; RNA-seq data, p=4×10⁻⁹, Welch ANOVA). (B) CXorf67 expression at the RNA level in different types and molecular groups of CNS tumor (data derived from DKFZ cohorts). (C) CXorf67 expression at the RNA level (Affymetrix u133v2 array data) across PFA subtypes and in PFB or ST ependymomas. PFA-1f tumors express CXorf67 at the same level as PFB and ST tumors, significantly different (p=7×10–18, Welch ANOVA) from other PFA tumors. (D) Strong CXorf67 immunoreactivity in a PFA-1c tumor. (E) Negligible CXorf67 expression in a PFA-1f ependymoma that has an H3 K27M mutation. (F) Almost identical expression levels of CXorf67 (Affymetrix u133v2 array data) in PFA ependymomas with or without a CXorf67 mutation (p=0.51 Welch t-test). (G) Heat map of methylation at CpG sites across the CXorf67 gene demonstrating relative hypomethylation (blue) in the promoter region (red bar) for PFA ependymomas, but relative hypermethylation (yellow) at the same sites for PFB / ST ependymomas. (H) Significantly higher CXorf67 promoter region methylation in H3-mutant tumors than in H3-wildtype tumors – average beta for 6 probes (p=3×10–13 Welch t-test). Scale bars (D/E) = 100μm.