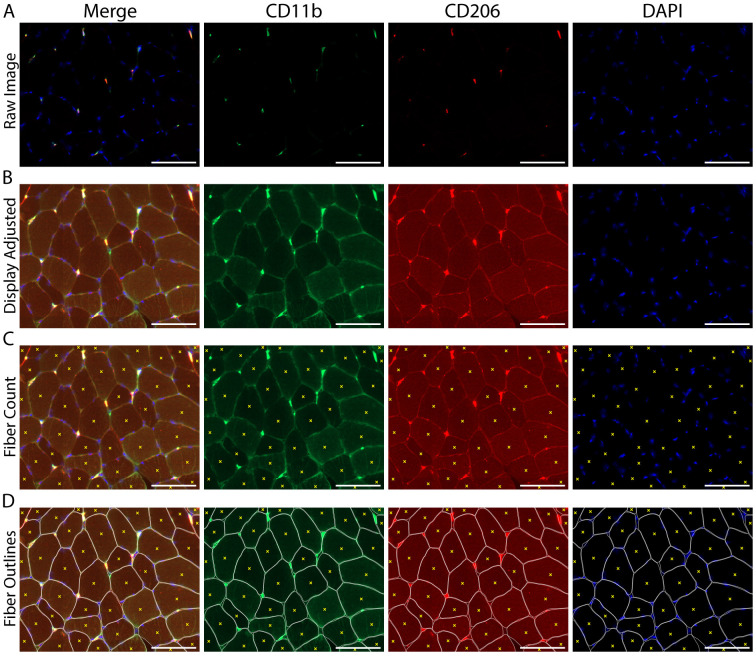
Figure 6. Image adjustment and counting of skeletal muscle fiber number within a cross-section.
A. Original image, prior to manipulation of the display settings; B. The same image following adjustment of the display to increase the visible background staining, allowing for the identification and counting of skeletal muscle fibers; C. Count of individual muscle fibers, denoted by yellow Xs; D. Fibers were manually outlined to help demarcate individual skeletal muscle fiber borders (white) along with the fiber count from panel C (yellow Xs). A-D) CD11b (green), CD206 (red), cell nuclei/DAPI (blue). Scale bars = 100 µm.

