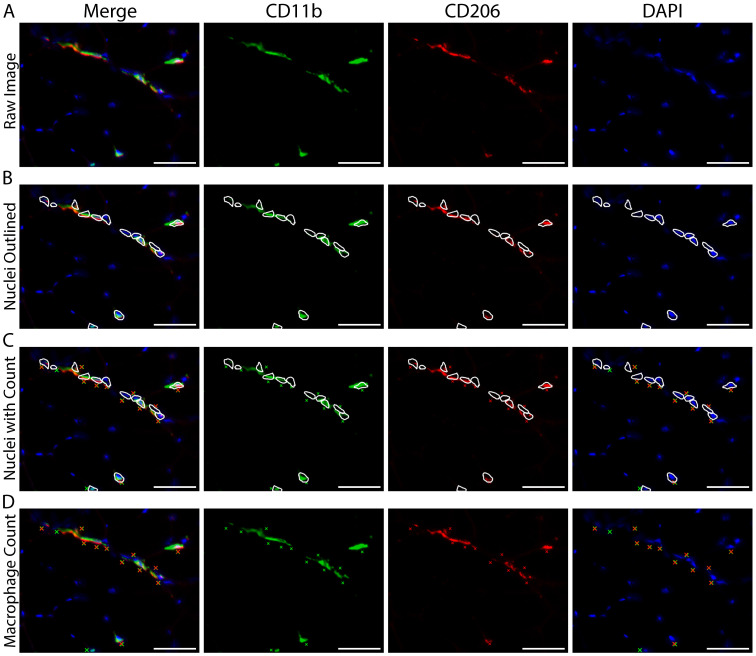
Figure 9. Counting macrophages when individual cells cluster together.
A. Representative image showing an area of macrophage staining with multiple nuclei where individual macrophages cannot be distinguished. B. The image in panel A, with outlines demarcating DAPI+ nuclei touching areas of positive macrophage staining. C. Panel B images including Xs marking each nucleus counted as positive macrophage staining. D. Original image from panel A showing the Xs in panel C marking macrophage counts without the outlines demarcating positive nuclei. A-D) CD11b (green), CD206 (red) and cell nuclei/DAPI (blue). Scale bars = 50 µm.

