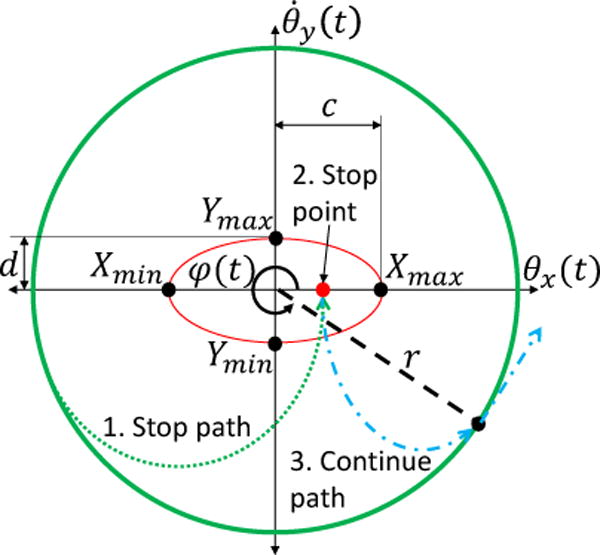
Fig. 2.

A depiction of the phase variable φ(t) measured from the circular orbit (thick green line) with a polar radius r (dashed black line) within the thigh phase portrait (θx(t), ) coordinates. The ellipse (red line) displays the predefined minimum and maximum X/Y coordinates (black dots) as well as its length of semi-axes c and d. A schematic for how start and stop detection method from Section II-D is used for a sequence of events. If a subject were to stop walking, the signal travels off the circular orbit (1. Stop path, dotted green line) to inside the ellipse (2. Stop point, red dot) near the origin. When the subject decides to continue walking then the orbital path continues (3. Continue path, dash-dot blue line) to the last recorded phase variable value to complete the stride along the circular orbit.
