
Fig. 5.
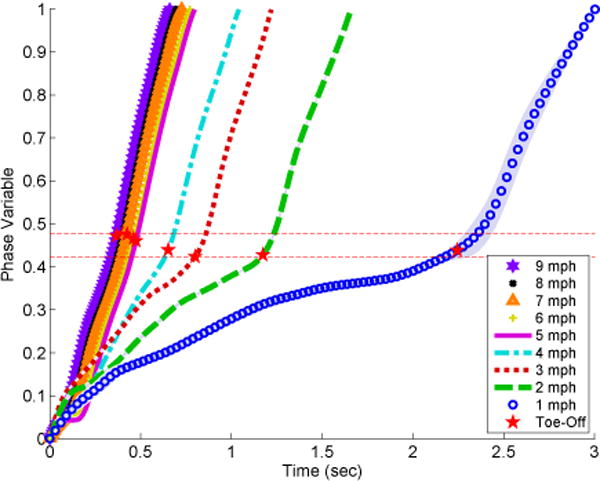
The normalized phase variable φnorm(t) vs. time across various treadmill speeds (1-9 mph) for 20 consecutive gait strides. Each phase variable curve represents the mean for that particular speed with ±1 standard deviation (shaded gray region, difficult to observe due to small variance). Toe-off is marked (red star) at the moment when the minimum thigh angle occurred. Horizontal red dashed lines give the lower and upper bounds of these events across the various speeds, demonstrating the ability of the phase variable to predict these events despite differences in timing. The slower speeds (1-3 mph) have a nonlinear phase trajectory due to a longer time duration in stance compared to swing, whereas faster speeds (≥ 4 mph) produce a linear phase trajectory due to a more even stance/swing split [2].