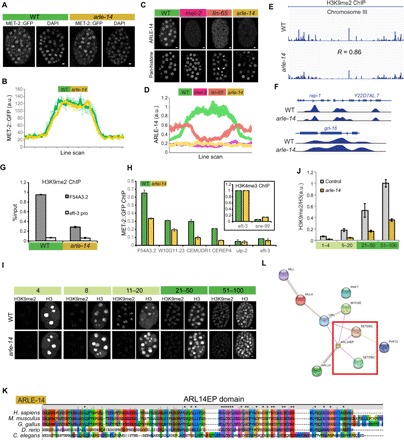
Fig. 5. ARLE-14 promotes chromatin association of MET-2.

(A) Whole embryos showing the distribution of MET-2::GFP in WT versus arle-14 mutants. Scale bars, 2 μm. (B) Line-scan analysis showing the mean MET-2::GFP intensity across embryonic cells in WT versus arle-14 mutant embryos. Average of line scans across multiple nuclei is shown, and error bars denote SEM. (C) ARLE-14 antibody staining in WT versus met-2, lin-65, and arle-14 mutants. (D) ARLE-14 line-scan quantitation. Average of line scans across multiple nuclei is shown, and error bars denote SEM. (E and F) H3K9me2 ChIP-seq (logLR) track in WT versus arle-14 mutant embryos (chromosome III and loci: rep-1, Y22D7AL.7, and grl-16). Five WT ChIP experiments and 10 arle-14 mutant ChIP experiments were pooled in for sequencing, and results are not quantitative. (G) H3K9me2 ChIP-qPCR in WT versus arle-14 mutants before combining parallel ChIP experiments together for sequencing. Error bars denote SEM. (H) MET-2::GFP ChIP-qPCR for WT (green) versus arle-14 (yellow) mutant embryos. Inset shows H3K4me3 ChIP-qPCR as a control. The y axis shows normalized %input values for both WT and mutants, where the %input value at the H3K4me3-positive region was set to 1 for both genotypes. %input for MET-2::GFP ChIP was adjusted accordingly. Error bars denote SEM for n = 3 experiments. (I and J) Acquisition of H3K9me2 in WT versus arle-14 mutants during embryogenesis, with an H3 costain (I) and quantitation normalized to H3 (J). Error bars denote SEM. (K) Amino acid sequence alignment of worm ARLE-14 to the human ARL14EP domain using ClustalX2. Color scheme: blue, hydrophobic; red, positive charge; magenta, negative charge; green, polar; pink, cysteines; orange, glycines; yellow, prolines; cyan, aromatic. (L) Protein interaction map for human ARL14EP from STRING database (https://string-db.org/). The red box highlights interactions with human SETDB1/2.
