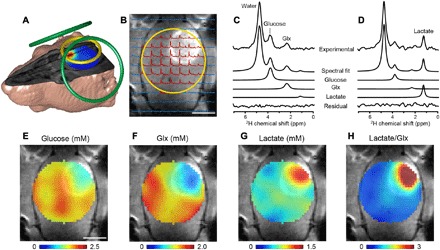
Fig. 2. DMI in rat brain after [6,6′-2H2]glucose infusion.

(A) MRI-based 3D rendering of a RG2 glioma rat with radiofrequency (RF) coil positioning for MRI, shimming (green loops), and DMI (yellow loop). The color-coded map overlaid onto the 3D MR image shows the lactate/Glx ratio. (B) Contrast-enhanced T1-weighted MRI in which the tumor appears hyperintense relative to normal brain tissue. The yellow circle shows the DMI surface RF coil position. As RF transmission and reception sensitivity profiles are highest close to the surface coil, the DMI field of view is effectively limited to the RF coil diameter. Localized 2H NMR spectra extracted from an 11 × 11 × 11 MRSI grid with 2 × 2 × 2 mm3 voxels are overlaid onto the MR image. The data shown were acquired between 60 and 90 min after starting the [6,6′-2H2]glucose infusion. Spectra shown in red had sufficient signal for further processing, whereas those in blue were discarded. Experimental 2H NMR spectra from (C) normal-appearing brain and (D) tumor lesion, with the spectral fitting results for the total spectrum, individual peaks, and fitting residue shown below. Note that localized spectra have higher spectral resolution than nonlocalized spectra (Fig. 1), a consequence of the smaller 8-μl volumes’ inherent increased magnetic field homogeneity. (E to H) DMI maps of 2H-labeled glucose and metabolites, based on spectral fitting of individual peaks, expressed in millimolar (E to G). The ratio of lactate/Glx (H) represents the Warburg effect, characterized by high glycolysis and low oxidative metabolism. Scale bars, 5 mm (B and E).
