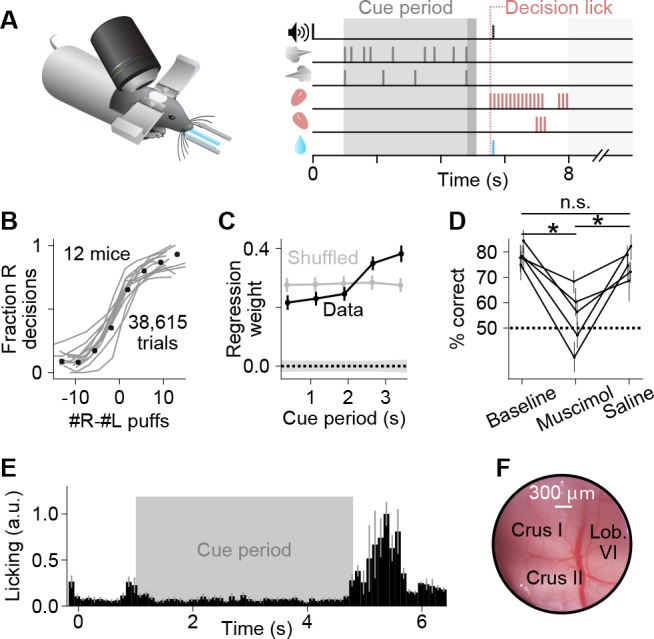
Figure 1. A somatosensory decision-making task that depends on the cerebellum.
(A) In each trial, two streams of random, temporally Poisson-distributed air puffs were delivered to the left and right whiskers. After a delay, mice licked one of two lick ports indicating the side with more cumulative puffs to receive a water reward. Gray-shaded regions from left to right: cue period, delay, intertrial interval. Decision lick: first detected lick after the delay. (B) Psychometric performance data on the evidence accumulation task. Gray lines, individual mice; black points, average across all trials from all animals (n = 38,615 trials, 12 mice). (C) Logistic regression analysis correlating animal choice with cues delivered at different time bins of evidence presentation, demonstrating that the entire cue period was used to guide decisions. Each point indicates the magnitude of that time bin’s influence on decisions (all points significantly greater than zero, Wald test, p<0.0001). For comparison, bins (gray points) or choices (shaded 1 s.d. gray zone) were shuffled. Error bars: 95% confidence interval. (D) Behavioral effect of bilateral injections of muscimol or saline into crus I, compared to baseline performance with no injections. Each set of joined points represents one mouse. Error bars: 95% confidence interval. *p<0.05, n.s.: not significant (two-tailed paired t-test). (E) Movie-based licking measurements from mice over the duration of trials. Bar heights show mean ±s.e.m. across animals of trial-averaged licking signals. (F) Example cranial window over the left posterior hemispheric cerebellum, indicating the site of imaging and inactivation.


