. 2018 Aug 13;7:e36781. doi: 10.7554/eLife.36781

Figure 2. Task-dependent modulation of Purkinje cell somatic calcium signals.

(A) Example two-photon field of view of Purkinje cell somata. (B) Traces of extracted calcium signals from somata indicated in (A). Shaded regions and ramps at top indicate cue periods. (C) Trial-averaged activity during evidence presentation from two example cells. Modulation index r was defined as the Pearson correlation between the averaged signal and time in the cue period. Confidence interval on traces indicates s.e.m. (D) Cue-period fluorescence modulation in all imaged somata (n = 4 mice, 843 cells). Modulation index r was computed preceding the cue period (‘pre-cue’) and during the cue period. (E) Trial-averaged activity during the cue period of neurons with the highest absolute modulation index (top 5%) in each session. ∆F/F signals are mean-subtracted. (F) Output of a linear decoder predicting the animal’s upcoming choice and the side with more evidence on a trial-by-trial basis using somatic data from the cue period of each trial. Each trace represents the mean ±s.e.m. (n = 6 sessions in four mice). Choice: side of the animal’s decision. Evidence: side with more evidence. Gray-shaded regions: cue period. Shuffle: relevant variable (choice or evidence, respectively) was shuffled across trials. Ind: relevant variable (choice or evidence, respectively) was shuffled while holding the other variable constant, to compute the independence of encoding of the relevant feature. *: p<0.01 (paired t-test using cue-period-only data).
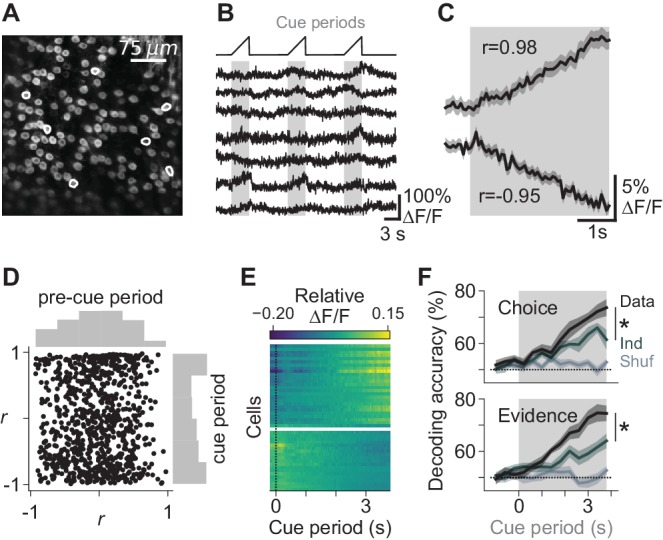
Figure 2.

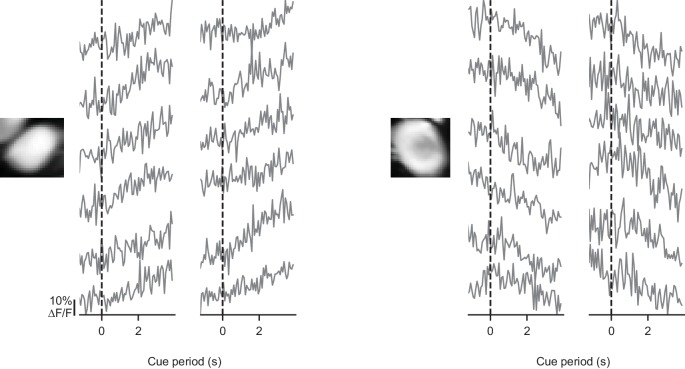
Figure 2—figure supplement 1. Somatic signals are modulated on individual trials.

Figure 2—figure supplement 1.

For two example somata, activity is shown in the cue period of 12 individual trials with modulated activity. Each trace derives from one trial. Evidence presentation begins at the dashed line.
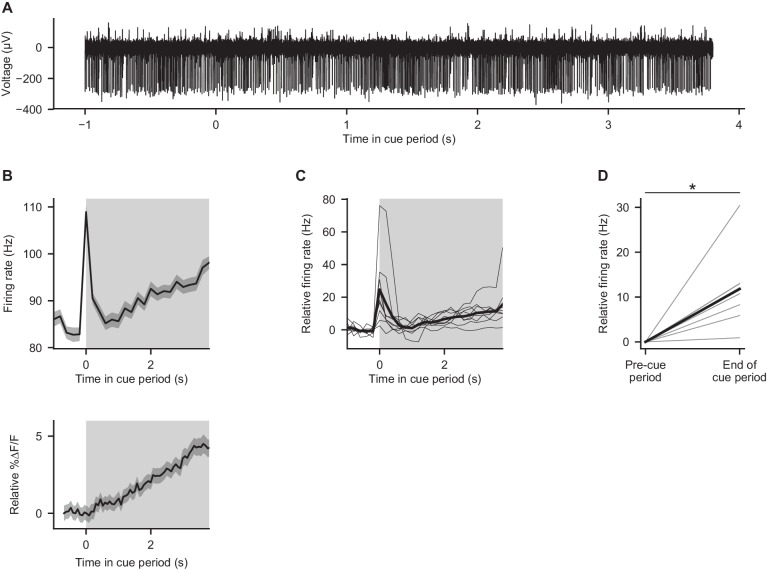
Figure 2—figure supplement 2. Electrical recordings from Purkinje cells during behavior.

Figure 2—figure supplement 2.

(A) Example electrophysiological recording from a crus I Purkinje cell during the cue period of one trial in a mouse performing the evidence accumulation task. (B) Top: trial-averaged activity of the cell shown in (A). Gray shading: cue period. Error shading: s.e.m. Bottom: trial-averaged calcium signal from the cell shown in Figure 2C, for comparison to electrical trace. (C) Trial-averaged activity of nine Purkinje cells from three mice. Thin lines: individual cells. Thick line: mean across cells. Gray shading: cue period. (D) Comparison of mean firing rates in the final 1 s of the cue period (‘end of cue period’) relative to the 1 s preceding the cue period (‘pre-cue period’). Thin lines: individual cells. Thick line: mean across cells. *p<0.001, two-tailed paired t-test.
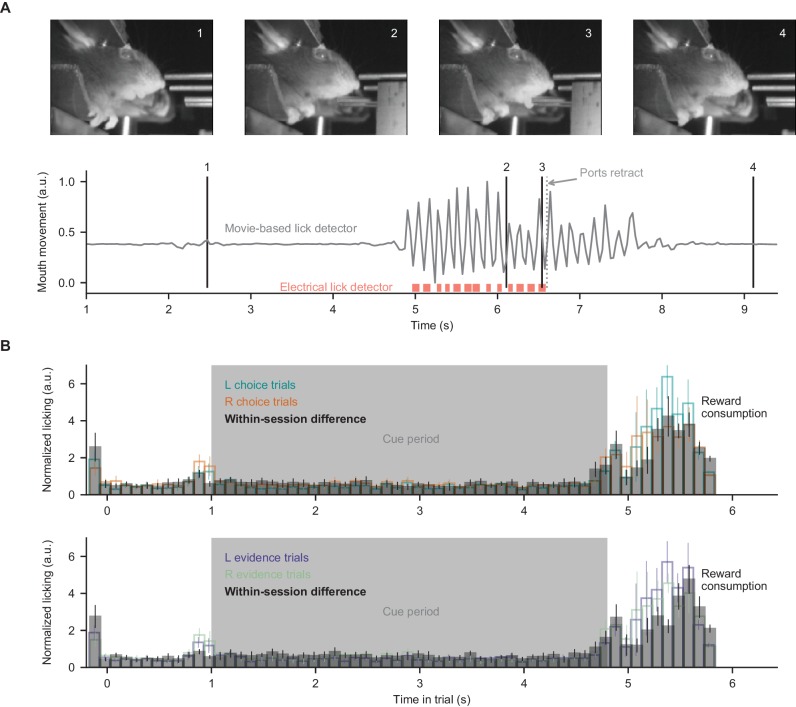
Figure 2—figure supplement 3. Movie-based licking measurements.

Figure 2—figure supplement 3.

For the closed-loop experimental apparatus, licks during decisions and reward consumption were measured by an electrical detector which retracted during evidence presentation. Therefore, here we measured licking during evidence presentation (when ports were retracted) using behavioral movies. (A) Mouth movement was measured using a region-of-interest analysis, and aligns with electrical measures of licking. (B) Licking measurements from all mice in all somatic imaging sessions, split according to the choice or correct side of the trials. Within-session difference: absolute difference between mean licking signals of the two displayed conditions, computed on a session-by-session basis. Bar heights indicate mean ±s.e.m. across sessions.
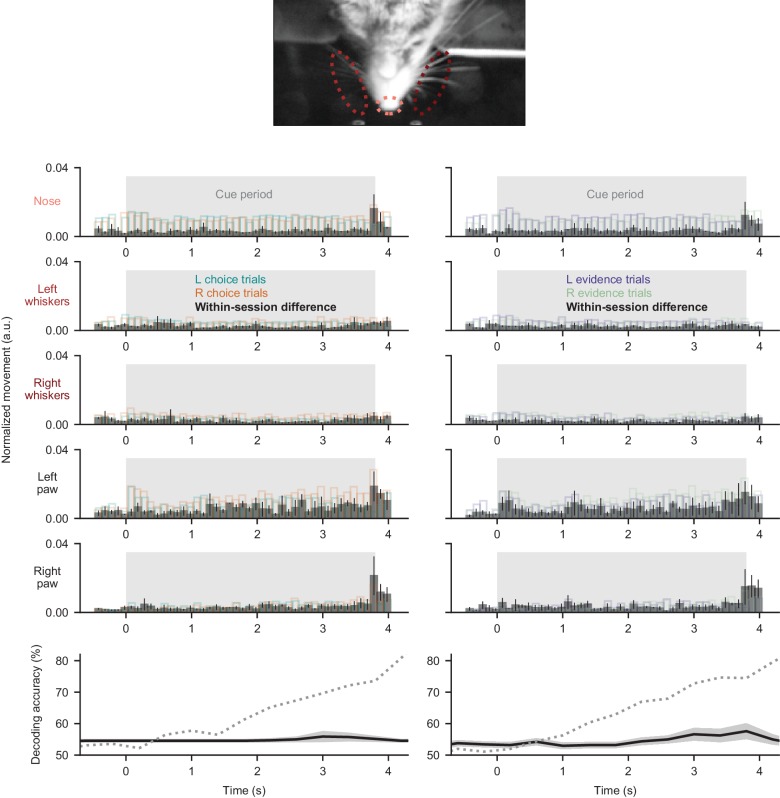
Figure 2—figure supplement 4. Movements do not explain somatic signals.

Figure 2—figure supplement 4.

Movements of the nose, whiskers, and paws were measured from behavioral movies (see Materials and methods, Video 2, Video 3). Top five rows: each row represents one movement parameter. Left column: movement quantified during the cue period and split according to the subsequent choice made at the end of the trial. Black bars were computed as the difference between left and right trials on a session-by-session basis. Right column: same as left, but trials were split according to the correct side of the trial (side with more evidence). Bar heights indicate mean ±s.e.m. across all somatic imaging sessions in all subjects. Mean movement rates did not differ across left- and right-choice trials (p=0.17 for nose, p=0.16 for left whiskers, p=0.61 for right whiskers, p=0.47 for left forepaw, p=0.33 for right forepaw; two-tailed paired t-test), or across left- and right-evidence trials (p=0.16 for nose, p=0.96 for left whiskers, p=0.47 for right whiskers, p=0.15 for left forepaw, p=0.72 for right forepaw; two-tailed paired t-test). Bottom row: decoding was performed as in Figure 2F, except using the above movement measurements as regressors. Solid line: decoding accuracy, error shading: mean ±sem over sessions. Dotted line: somatic decoding accuracy from Figure 2F for comparison.