. 2018 Aug 13;7:e36781. doi: 10.7554/eLife.36781

Figure 3. Purkinje cell representations of choice and evidence.

(A) Left: mean activity of four example somata during the cue period, split according to the choice made in each trial. Traces represent mean ±s.e.m. over all trials of a particular choice. Right: summary of the relationship between modulation index r and animal choice for all imaged cells. Red x’s: cells shown on left. (B) Top: mean cue-period activity in correct trials from one example cell, split according to the strength of evidence presented (strong: #L puffs > 9; weak: #L puffs < 2). Bottom: mean puff-triggered response of one example cell to left (L)- and right (R)-sided puffs. Mean t1/2 decay: 406 ms. Shading: s.e.m. (C) A linear model was used to determine the influence of left- and right-sided puffs on pre-decision fluorescence activity for each cell over all trials. Left: each dot represents one cell. Modulation: normalized coefficient of the linear fit between puff number and fluorescence. Colored data points indicate cells with significant coefficients. Right: Proportion of cells in each category on left. Shuffle: puff counts were shuffled across trials of the same choice before regression. Percent of modulated cells is significantly above the shuffle for the +L, +R and ±(L,R) conditions (p<0.0001, two-tailed z-test). (D) Mean cue-period activity in correct trials across all evidence-modulated cells, split according the level of evidence presented in the trial (strong: #pref side puffs-#nonpref side puffs > 8; weak: #pref side puffs-#nonpref side puffs<-8).
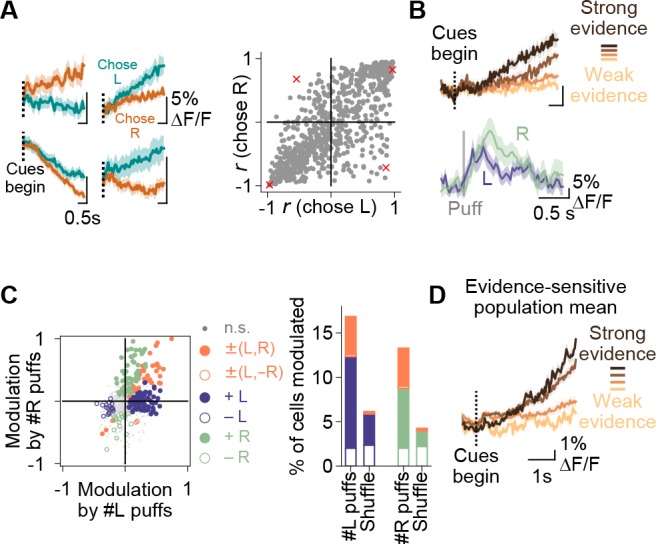
Figure 3.

Figure 3—figure supplement 1. Somatic modulations are absent in a task-free context.

Figure 3—figure supplement 1.

Mice not trained to perform the decision-making task were imaged during behavioral sessions in which stimuli were delivered in the same manner as in the task (n = 2 mice, 449 trials, 168 cells). Analyses of fluorescence modulation, decoding, and evidence representations were performed as in Figures 2D,F and 3C, respectively. (A) Comparison of fluorescence modulation index in the pre-cue and cue periods, as in Figure 2D. The percentage of cells in which cue-period fluorescence was better correlated with time than pre-cue-period fluorescence was 46% (95% CI: 40–53%, bootstrap), statistically indistinguishable from the percentage when cue and pre-cue period identity was shuffled (46% of cells; 95% CI: 39–52%). (B) Decoding analysis was run as in Figure 2F (bottom panel), predicting the side with more evidence using fluorescence measurements. To facilitate comparison of data from mice performing the task (grey line) and those not performing the task (black line), subsets of the data matched in trial and cell count were subsampled 1000 times from each condition, and the lines show mean ±std of decoding accuracy for each. Peak decoding accuracy was significantly higher in the task context than in the no-task context (p=0.03; fraction of subsamples in which peak decoding accuracy in no-task-context sample exceeded that in task-context sample). (C) As in Figure 3C, linear modeling was used to relate fluorescence to puff count on a trial-by-trial basis. Procedure and conventions follow Figure 3C, demonstrating the fraction of cells with significant modulation by evidence. Percent of modulated cells is statistically indistinguishable from the shuffle condition for all modulations (p>0.05, two-tailed z-test).