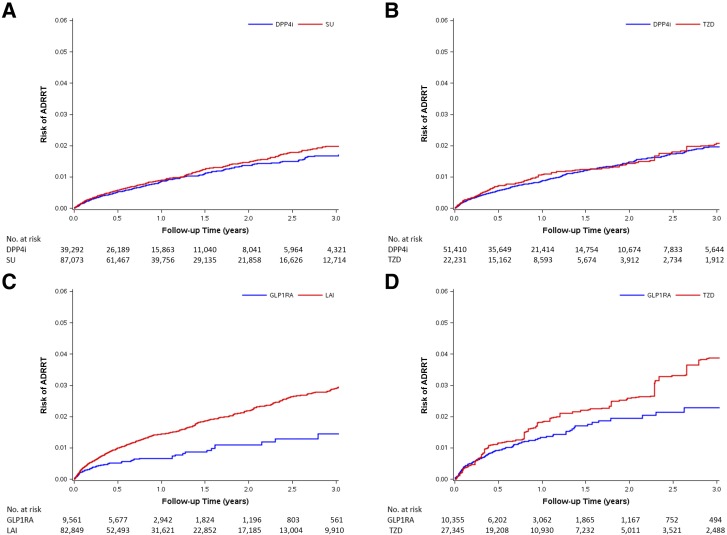
Figure 1.
SMR-weighted Kaplan-Meier plots of ADRRT. A: DPP4i vs. SU cohort. HR 0.91 (95% CI 0.79–1.04). B: DPP4i vs. TZD cohort. HR 0.91 (95% CI 0.75–1.11). C: GLP1RA vs. LAI cohort. HR 0.50 (95% CI 0.39–0.65). D: GLP1RA vs. TZD cohort. HR 0.75 (95% CI 0.53–1.06). SMR weights create a pseudo-population of the untreated (comparators: SU, TZD, or LAI), which has the same covariate distribution as the treated (IBT). Every patient receiving IBT has a weight of 1, whereas every patient in the comparator group is weighted by PS/(1 − PS). The risks on the y-axis were obtained by a SMR-weighted Cox model (weighting comparator drug initiators by the PS odds [PS/(1 − PS)]). HR treats comparators as reference, and adjusted HR <1 indicates a lower risk for IBT.

