Fig. 1.
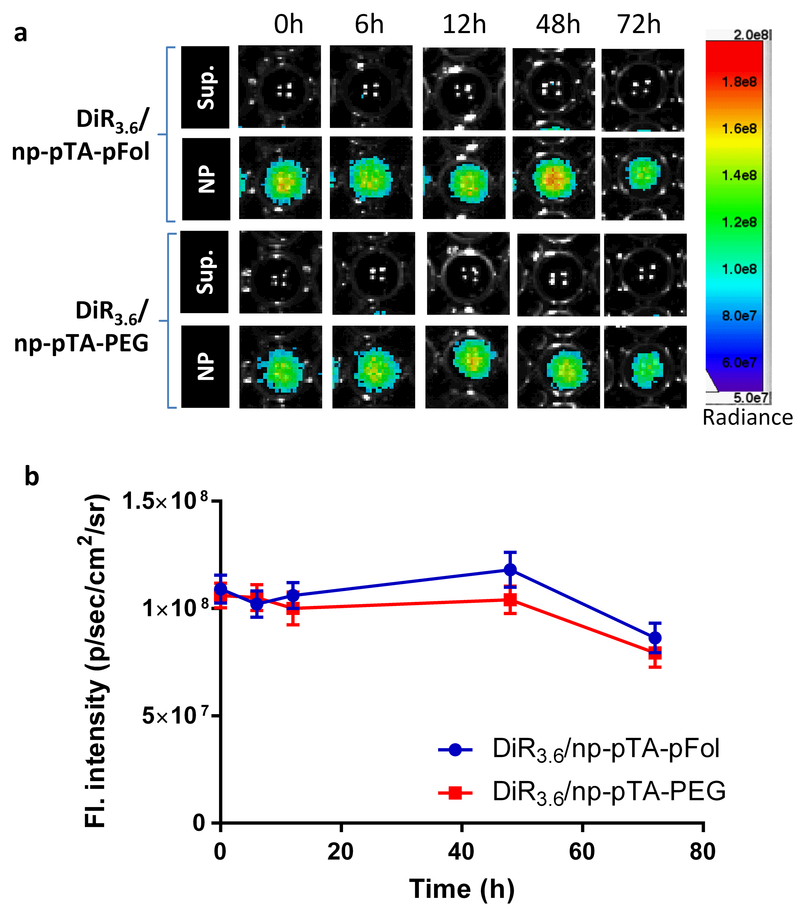
Stability of DiR3.6/np-pTA-pFol and DiR3.6/np-pTA-PEG in mouse serum (NPs: 1 mg/mL, DiR loading: 3.6%). (a) Fluorescence images of supernatants and NPs (redispersed in fresh mouse serum) collected at different time points during the incubation in mouse serum. (b) Fluorescence intensity of the NPs collected at the specified time points and redispersed in fresh mouse serum, quantified by the AMI viewer image software. Error bars: s.d. of 3 readings of the same sample in a representative experiment. The measurement was repeated with an independently prepared batch of NPs (Fig. S7).

