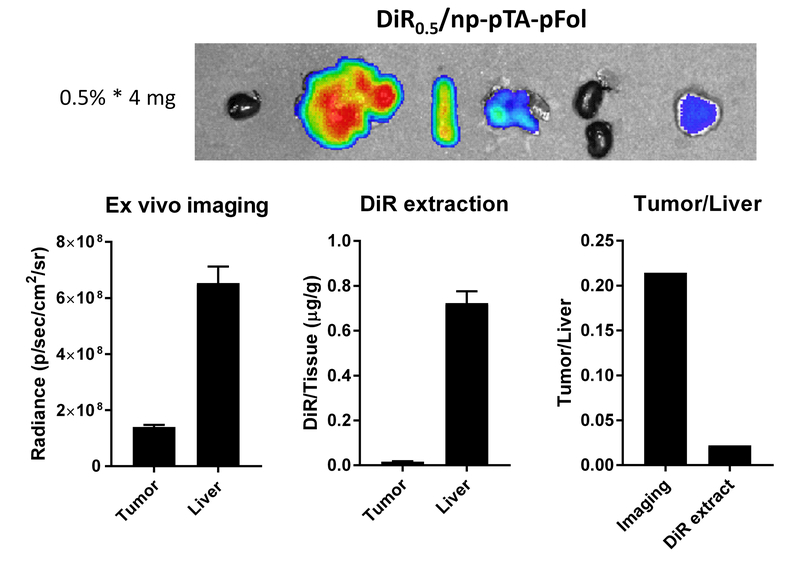
Fig. 5.
Comparison of fluorescence signals of tumor and liver and their ratios quantified by ex vivo fluorescence image analysis and by liquid-liquid extraction. Images and organ samples were obtained from a mouse receiving 4 mg of DiR0.5/np-pTA-pFol at 72 h after tail vein injection. Error bars: s.d. of 3 readings of the same subject. The experiment was repeated with an independently prepared batch of NPs and presented in Fig. S18.

