Figure 3.

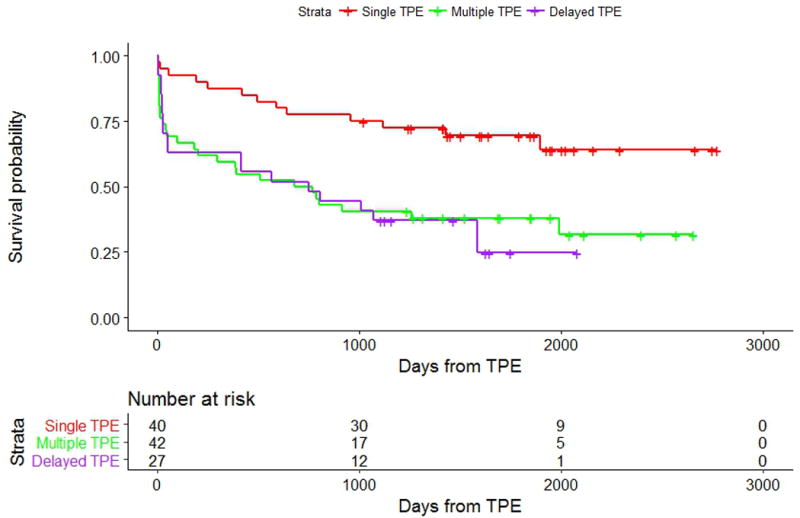
Kaplan Meier curves of TPE survival between the 3 TPE cohorts (Single, Multiple, and Delayed). The number of events in the Single, Multiple and Delayed TPE cohorts respectively was 13/40, 27/42, and 19/27 (log-rank p-value = 0.001).

Kaplan Meier curves of TPE survival between the 3 TPE cohorts (Single, Multiple, and Delayed). The number of events in the Single, Multiple and Delayed TPE cohorts respectively was 13/40, 27/42, and 19/27 (log-rank p-value = 0.001).