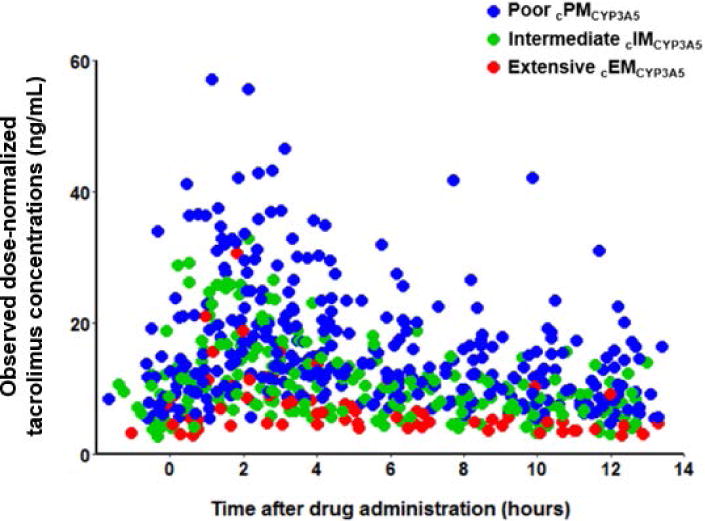
Figure 2.

Observed tacrolimus dose-normalized concentrations (ng/mL) compared to time after drug administration stratified by CYP3A5*3*6*7 metabolic composite. For each patient, tacrolimus concentrations were divided by the recipient’s dose and multiplied by the mean study dose for the population which was 3.4 mg. The red, green, and blue dots represent individual tacrolimus concentrations for CYP3A5 extensive (cEMCYP3A5), intermediate (cIMCYP3A5) and poor metabolizers (cPMCYP3A5).
