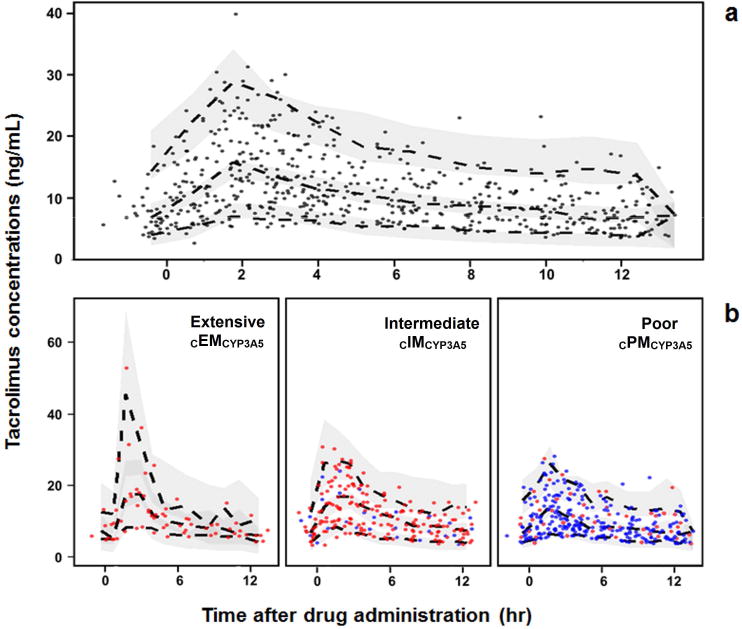
Figure 4.

Prediction-corrected visual predictive check (PC-VPC) for the final tacrolimus pharmacokinetic model. PC-VPC for all patients a), and PC-VPC stratified by CYP3A5*3*6*7 metabolic composite b). Solid circles represent the observed data. The dashed lines represent the 5th, 50th, and 95th percentiles of the observed data, and the shaded areas represent the 90–percent confidence intervals around the 5th, 50th, and 95th percentiles of the predicted data. Symbol colors in panel b represent white (blue) and African-American (red) patients.
