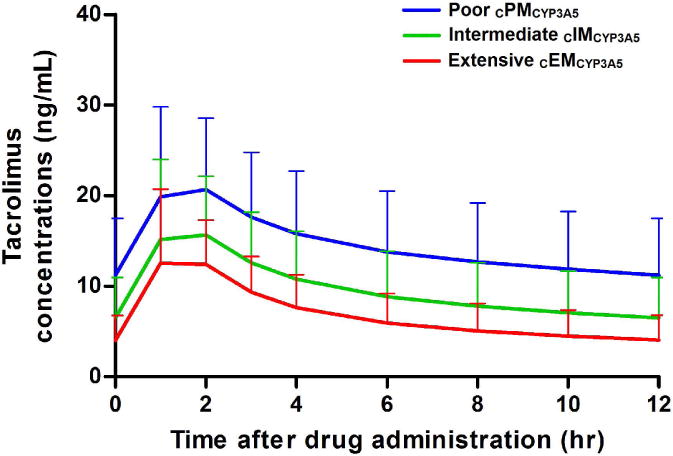
Figure 5.

Simulations (n = 1000) of oral tacrolimus concentration-time profiles at steady-state after administration of 0.075 mg/kg/day (0.0375 mg/kg every 12 hours), represented by the mean and standard error bars according to CYP3A5*3*6*7 metabolic composite. Poor metabolizers (CPMCYP3A5) exhibit higher exposures (mean AUCss,0–12hr 170 hr.ng/mL) and 12 hr trough concentrations (mean 10.9 ng/mL) compared to intermediate(CIMCYP3A5) (AUCss,0–12hr 116 hr.ng/mL and trough 6.70 ng/mL) and extensive (CEMCYP3A5) metabolizers (AUCss,0–12hr 80.8 hr.ng/mL and trough 4.05 ng/mL).
