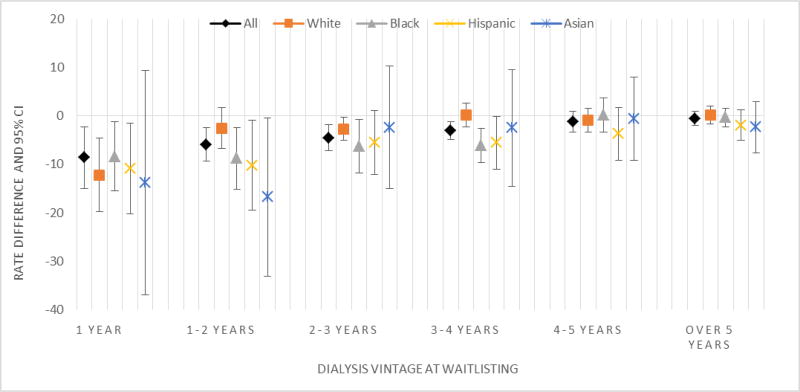
Figure 3. Change in adjusted rate of waitlisting among prevalent ESRD patients in the United States post-KAS (vs pre-KAS) by patient time on dialysis, derived from interrupted time series models, 2011–2015.
Abbreviations: ESRD, End stage renal disease; KAS, kidney allocation system
Note: The interrupted time series regression model adjusted for time trends. The coefficient represented in the Y axis represents the estimated change in waitlisting rate associated with KAS, after adjusting for time trends. Negative coefficients indicate declines in waitlisting. Patients who were waitlisted prior to dialysis start were excluded from these analyses. P-values for trend test for the association of change in rate of waitlisting by dialysis vintage is as follows: all patients (p<0.0001); white (p=0.058); black (p=0.011); Hispanic (p=0.002); and Asian (p=0.052).

