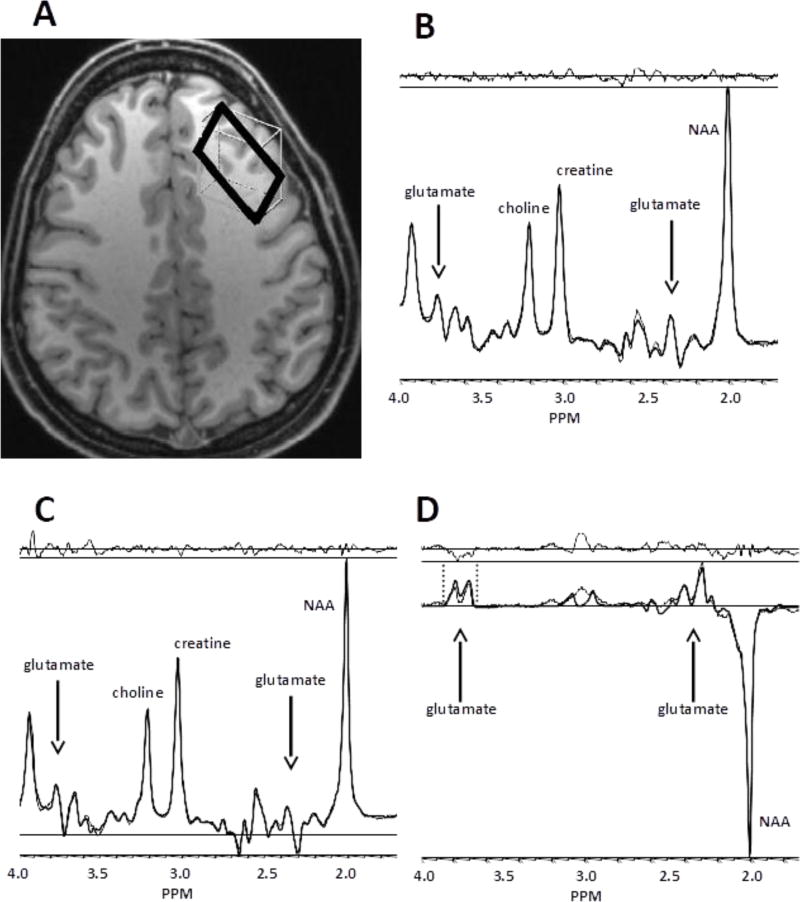
Figure 1. Voxel location and typical spectra.
Panel A depicts an axial slice showing the dlPFC voxel. Panels B, C, and D show examples of PRESS, MEGA-PRESS off-resonance, and MEGA-PRESS difference spectra, respectively. For B through D, the model fit (heavy line) is superimposed on the raw spectral data (fine line). The residual (fit minus raw data) is shown at the top of each panel. Arrows indicate locations of visible glutamate resonances. Note that glutamine and other resonances may overlap visually with glutamate resonances. Vertical dashed lines in D indicate the ppm range used for peak integration of the glx resonances centered at 3.74 ppm.

