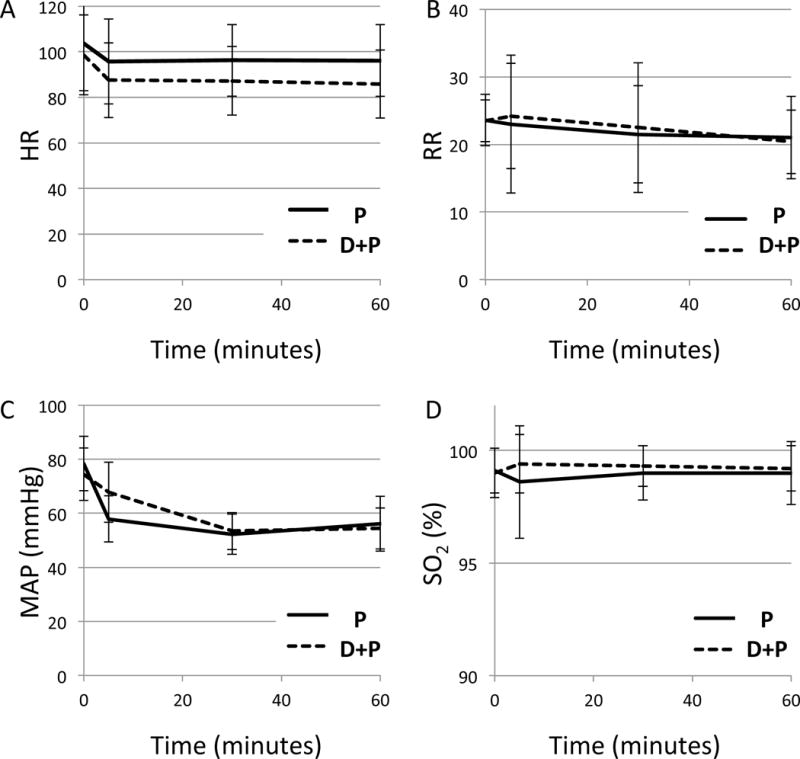
Figure 1.

Hemodynamic and respiratory parameters during the sedation. A, heart rate (HR,/min); B, respiratory rate (RR,/min); C, mean arterial pressure (MAP, mmHg); D, oxygen saturation (SO2, %). Time starts at the time of induction (0).
Group P (propofol only); Group D+P (propofol with dexmedetomidine bolus)
Error bars represent standard deviation.
A. There was a significant difference in two groups across time points (p<0.0001)
B. There was no difference between two groups (p=0.17)
C. There was a significant difference in MAP across the time (p= 0.004). Two groups were different at 5 minutes after induction.
D. There was no difference between two groups in SO2 (p=0.76).
